Help Us Pass Federal Farm Legislation!
What You’ll Learn From This Report
- 1: Introduction
- 2: The Rise of The Hog Bosses
- Iowa becomes ground zero for factory hog farms
- 3: Hog Farms Did Not Bring Prosperity to Rural Iowa
- Counties with the most factory farm development score lower on numerous economic indicators
- 4: The Factory Farm Industry Is Driving Climate Change
- We need to support diverse family-scale farms
- 5: Conclusion and Recommendations
- We cannot solve this crisis without combating corporate power
- 6: Methodology
Part 1:
Introduction
In December 2019, U.S. hog slaughterhouses were operating at nearly 100 percent capacity. The system was functioning as designed; corporations profit by maximizing output and contracting with large operations to ensure a steady stream of hogs.1 But the system buckled just a few months later as the United States entered pandemic lockdown. Plummeting foodservice demand and shuttered slaughterhouses created backlogs of hogs that depressed prices and forced some farmers to euthanize their animals. Meanwhile, meat disappeared from store shelves, while processors used their reserves to export record amounts of meat abroad.
We can place some blame on the pandemic for a bad year in farm country. But the reality is that the current centralized, corporate-controlled food system was not built for resiliency, or even to support family-scale farms. Nowhere is this more evident than in Iowa’s factory hog industry. This second issue brief in our ongoing series on the Economic Cost of Food Monopolies explores how massive growth in hog production has failed to bring economic prosperity to Iowa’s rural communities.
Food & Water Watch analyzed the economic welfare of Iowa counties with the most hogs sold and the largest hog farms, from 1982 to 2017. We found that:
- Iowa lost nearly 90 percent of its hog farms from 1982 to 2017, as rapid factory hog expansion drove out smaller, family-scale farms.
- Overproduction — and growing corporate consolidation — pushed down the real price of hogs. Today’s farmers earn $2 less per pound of hog produced compared to 1982, while the retail price fell only $1; slaughterhouses, processors and retailers are capturing the other $1.
- Counties that sold the most hogs and those with the largest farms suffered declines across several economic indicators — including real median household income and total wage jobs — over roughly the same time period. These counties also experienced significant population decline — twice the rate of Iowa’s more rural counties.
- The factory farm industry depends on the overproduction of feed grain like corn and soybeans. Yet grain farmers also experienced significant real price drops between 1982 and 2017 — 52 and 39 percent per bushel, respectively, for corn and soybeans. Iowa also lost more than 40 percent of its corn and soybean farms as production shifted to the largest operations.
As we continue to manage the pandemic, we need to fundamentally transform the way we produce and process food, especially in animal agriculture. Fortunately, the path forward is clear. It starts by banning new and expanding factory farms.a We must also restore supply management in upcoming Farm Bills and improve antitrust oversight and enforcement. Only then can we build a food system that achieves both economic and climate stability.
aWe define “factory farms” as operations meeting the following size categories: 500 or more beef cattle (on feed), 500 or more dairy cows, 1,000 or more hogs, 500,000 or more broiler chickens sold annually, and 100,000 or more egg-laying hens. These are based off of inventory categories used by the U.S. Department of Agriculture’s Census of Agriculture and roughly align with the U.S. Environmental Protection Agency’s definition of a medium-sized concentrated animal feeding operation (CAFO).
Part 2:
The Rise of The Hog Bosses
Iowa becomes ground zero for factory hog farms
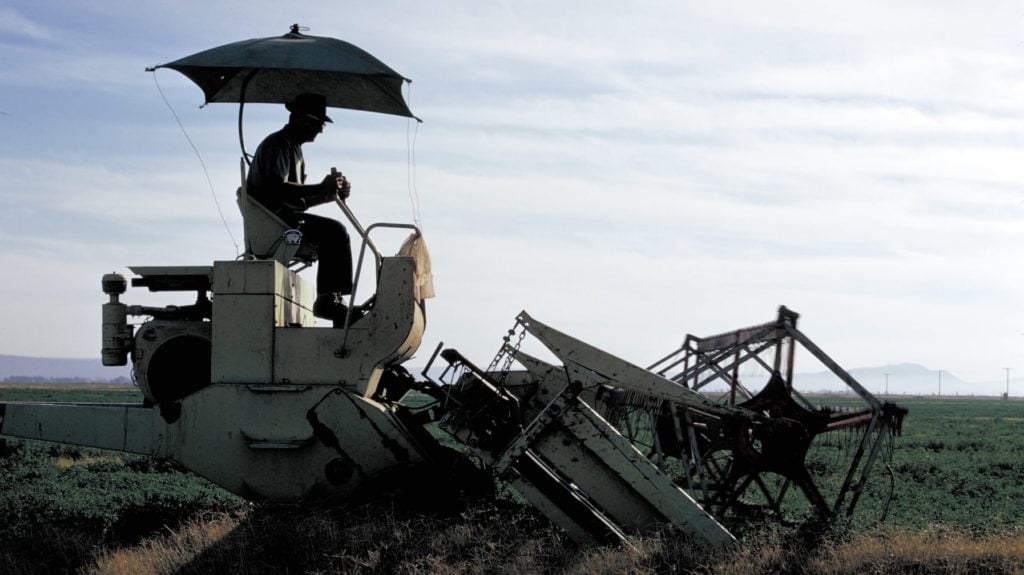
Pig farm. Photo credit: CC-BY-2.0 / Farm Watch, Flickr
Up until the late 20th century, most hogs were raised on smaller, diversified operations. It was often cheaper to grow feed onsite, thereby limiting the number of hogs that a single farm could raise.2 But significant changes in U.S. farm policy and corporate power transformed the way we grow crops and raise livestock.
The U.S. government once had a robust food supply management system that prevented overproduction, a key contributor to low crop prices. New Deal farm policies encouraged farmers to voluntarily cut back production in exchange for price supports. These programs provided living wages to farmers of certain commodities and backgrounds, for much of the 20th century.3
But as U.S. antitrust enforcement eroded and agribusinesses amassed power, corporations lobbied to dismantle these systems to expand global commodity trading. The U.S. government embraced free trade, aiming to increase domestic production and to use expanding export markets to soak up excess commodities. In the 1970s, the agriculture secretary famously directed farmers to “plant fencerow to fencerow.” Many took heed, taking out loans to expand their operations.4
But this all came crashing down in the 1980s. The export market proved volatile and grain prices crashed, leaving farmers with huge debt that they could not repay. Thousands of farms were foreclosed. Those that remained looked to new production models, including contract hog production, to save the farm.5
The death of supply management created a glut of low-priced grain, which agribusinesses purchased and processed into cheap livestock feed. It was now cheaper for farmers to purchase feed offsite and raise their livestock in confinement.6 And Iowa, with its ready supply of feed input crops like corn and soybeans,7 became ground zero for factory hog expansion.
More hogs, fewer farms
Cheap feed is one part of the equation that fueled rapid factory farm growth. Another is growing corporate consolidation within the meat slaughtering and processing industry. In 1980, the top four pork processors slaughtered one out of every three U.S. hogs. Over the past 40 years, their market share has doubled (Figure 1).8 Concentration at the local level can be even more extreme. For instance, between 2004 and 2011, the top four firms slaughtered 9 out of 10 Iowa hogs.9
Extreme market power gives corporations greater leverage to dictate farm prices and practices. Until the early 1990s, most hogs were sold in “spot markets” like live auctions, where multiple buyers competed to purchase a farmer’s hogs. Iowa alone had around 200 such facilities.10 Competition among buyers helped secure fair prices for farmers.11
But corporate consolidation reduced the number of buyers vying for Iowa’s hogs. Those that remained put pressure on the industry to expand their herd sizes, preferring to bargain with a few very large farms rather than numerous family-scale ones. Some buyers use production contracts, paying farmers to raise hogs owned by the processor — a near-universal practice in the broiler chicken industry. Marketing contracts, however, are more common in the hog industry, where farmers agree to deliver a set number of hogs at a future date. In both cases, farmers swap independence for a guaranteed income/buyer.12
In 1993, more than 80 percent of all hogs sold nationally were negotiated on the spot market. Two decades later, this had fallen to as low as 3 percent. Such a “thin” hog market prevents fair pricing and contributes to market volatility. This impacts farmers selling under marketing contracts as well, since the prices they receive are often tied to the spot market.13
A market dominated overwhelmingly by marketing contracts and with few negotiated hogs gives greater leverage to processing corporations. It is also open to manipulation. Pork processors have abused the system in various ways; one example is flooding the auction floor with their own hogs, driving down the spot market price just as a marketing contract is delivered.14
Corporate takeover of the hog industry has provided windfall profits to processing companies, but has gutted farm income.15 Nationally, farmers today are earning $2 less per pound of pork than in 1982 (adjusted for inflation). That’s a third of the value earned in 1982. But we are paying only around $1 less per pound at the grocery checkout. Pork processors and retailers are capturing the other dollar (Figure 2).16 In fact, the average net returns among Iowa’s wean-to-finish hog operations were negative for nearly half the years between 2004 and 2019.17
Part 3:
Hog Farms Did Not Bring Prosperity to Rural Iowa
Counties with the most factory farm development score lower on numerous economic indicators
Main Street in Readlyn, Iowa. Photo credit: CC BY-SA 3.0 / Orange Suede Sofa, Wikimedia Commons
Iowa’s farming landscape looks significantly different today than just a couple of decades ago. In 2017, Iowa sold 2.5 times as many hogs as in 1982. And the average number sold per farm each year has swelled nearly 20-fold, to 9,600 hogs per farm. Today, one out of every four U.S. hogs comes from Iowa. Yet the state lost almost 90 percent of its hog farms over this same period (Figure 3).
Moreover, our findings indicate that pork processors are capturing greater shares of profits, while farmers are feeling the pinch. In fact, the farmer’s share per pound of pork sold dropped two-thirds between 1982 and 2017 (adjusted for inflation). This suggests that the factory farm industry’s takeover of Iowa is not benefiting most farmers or rural communities. Instead, it shifts economic output from small, family-scale operations to a handful of very large operations — and ultimately to the pork processing corporations.
The study
A 2012 Food & Water Watch economic analysis,18 reviewed by the Agricultural Policy Analysis Center (APAC) at the University of Tennessee, is a valuable case study in what happens when governments endorse and enable factory farm growth. From 1982 to 2007, as factory farms mushroomed across the Iowa landscape, the value per hog sold to the Iowa economy actually declined. Moreover, the gains from hog sales are more unevenly distributed today, with fewer (but much larger) farms across virtually every Iowa county. This concentrates wealth among the largest farms, which in turn tend to make fewer local purchases than their smaller counterparts. This has cascading effects across the entire economy.
The 2012 study also compared the economic and social well-being of counties with the most hog sales and the largest farms to counties with fewer sales and smaller farms. We updated many of these comparisons using data from the 2012 and 2017 Censuses of Agriculture, while adding a few more. (For details, see the Methodology section.) The results suggest that failure to stop factory farm expansion and eliminate subsidies to the industry is wreaking havoc on Iowa’s farm economies. The results also counter the industry narrative that pork processors are building wealth and jobs in rural communities.
More hogs, less income
The National Pork Producers Council19 boasts that the U.S. pork industry supports over $22 billion in personal income.b We found that on a per capita basis, personal income increased in each Iowa county over the study period of 1982 to 2017. There were not significant differences in growth rates between counties with high hog sales and large farms, and those with fewer sales and smaller farms. The same is true even when comparing urban to rural counties.
However, measuring total personal income (not accounting for population) tells a different story. Iowa’s top hog-producing counties saw real total personal income fall roughly 8 percent from 1982 to 2017. In contrast, it ballooned 181 and 142 percent, respectively, among counties that sold fewer hogs and have smaller farms. Even Iowa’s more rural counties saw a 41 percent growth in real total personal income.
In other words, significant population losses (detailed below) went hand-in-hand with the drop in total personal income in counties with high hog sales and large farms. Moreover, per capita income measurements can mask economic inequality, especially when a few large earners bring up the county average. Median household income can help account for this by finding the middle point among all households in a sample.20
For instance, the real median household income among counties with high hog sales and large farms was between 6 and 7 percent less in 2017 than in 1979 (Figure 4). In contrast, it increased slightly within counties with fewer sales and smaller farms. Real median household income even increased modestly among Iowa’s rural counties. These findings suggest that the income benefits of factory hog production are not evenly shared across households living in counties with the most hog production — even though these counties collectively increased their hog production three-fold.
Job losses both on and off the farm
One of the most compelling findings of this report relates to employment. The factory farm industry likes to claim that its industrial model creates jobs — and to stoke fears about job losses to oppose regulation.21 However, the data do not support this. Instead, the rise of Iowa’s factory farms coincided with significant job losses both on and off the farm.
Statewide, total farm employment dropped 44 percent between 1982 and 2017. Every single Iowa county experienced double-digit declines in farm jobs. However, job losses among the top hog-producing counties exceeded the state average — and were even slightly higher than among rural counties overall (Figure 5).
Our previous report came to a similar conclusion: Farm size matters more than total hog output when it comes to job creation. Other studies echo this conclusion, including a 2021 analysis comparing job creation between Iowa’s conventional hog farms and those practicing pasture-based farming. (The average pasture-based farm in the study sells 600 hogs per year, compared to the state average of 9,600). The economic analysis found that the pasture-based farms created more than three times as many jobs per 100,000 hogs marketed compared to conventional farms. They also contributed more indirect and induced jobs.22
Iowa counties with high hog production lost jobs in other industries as well, including manufacturing and retail, whereas counties with low hog production and small farms gained jobs. When looking at all wage jobs, top hog-producing counties saw 30 percent declines from 1982 to 2017. Those counties selling fewer hogs and with smaller farms saw 131 percent and 102 percent growth in total wage jobs, respectively (Figure 6) — outstripping population growth rates by roughly 2:1. Even rural counties saw a 12 percent growth in jobs over the study period.
Simply put, the factory farm model is both anti-farm (pushing family-scale farms to foreclosure) and anti-job (reducing employment both on and off the farm).
Business and retail
Factory farms have cascading impacts on all sectors of the local economy. This is due in part to the different purchasing patterns between small and large farms. For instance, Iowa’s average large wean-to-finish operation purchases only $1 out of every $3 of inputs locally.23 Numerous economic analyses underscore the importance of small farms to local economies; some studies have concluded that smaller farms make more local purchases than larger farms, thereby supporting local retail and contributing to the “multiplier effect” that occurs when wealth is circulated in a local economy.24 Another study found that small, family-scale hog production models shift more profits from corporations to farmers, and induce more household spending among affected workers and farm owners.25
Our study aligns with these analyses. While Iowa experienced an estimated 2 percent decline in total retail businesses between 1982 and 2017, the counties with high hog sales and large farms saw extreme declines — 40 percent and 33 percent, respectively (Figure 7). This decline was even more severe than in rural counties. Counties with low hog sales and small farms, in contrast, saw double-digit growth in retail businesses.
Similarly, while Iowa lost nearly 60 percent of its grocery stores from 1982 to 2016,c losses among counties with high hog sales and large farms were even more stark —75 and 70 percent losses, respectively. This is even greater than losses in the most rural counties. In contrast, losses among low hog sales and small hog farm counties were lower than the state average.
The only business categories considered in this report that had positive growth among high hog-producing counties were meat slaughter and processing plants. However, growth still trailed that of the state as a whole. In fact, most of the growth in meat slaughter and processing facilities occurred in counties with low hog sales and small farms, as well as in rural counties. This could be due to a number of factors, including proximity to the workforces, transportation infrastructure and sewage treatment systems necessary to run slaughter facilities. It is also worth noting that more than a quarter of all hogs raised in Iowa are slaughtered across state lines.26
Before we commend the factory hog industry for a growth in livestock slaughterhouse and processing jobs, it is clear that the quality of these jobs has declined significantly over the past few decades. As meatpacking conglomerates rose in power, working conditions at their plants deteriorated; union representation declined, wages were cut, and conditions became more dangerous.27 In fact, today’s slaughterhouse workers suffer twice the rate of reported injuries and illnesses compared to the manufacturing sector as a whole.28 The COVID-19 pandemic revealed the willingness of pork corporations to put profit ahead of worker health and wellbeing, as corporations fought to keep plants open despite outbreaks that were killing workers.29
Population losses and net migration
Iowa’s total population grew 8 percent from 1982 to 2017. However, counties with high hog sales and large farms saw their populations decrease by 44 percent and 36 percent, respectively. In contrast, the populations of counties with low hog sales and small hog farms boomed 73 percent and 47 percent, respectively. These differences cannot be chalked up to rural and urban divides alone; population loss in rural counties was 18 percent — at least half as much as in counties with high hog sales and large farms.
Additionally, counties with high hog sales and large farms experienced greater rates of net migration compared to counties with low hog sales and small farms. We cannot make sweeping claims about why populations are leaving these counties based on numbers alone. Job losses, decline of rural services, and nuisance and public health concerns from nearby factory farms could all play a role and deserve greater attention. This negative net migration can have cascading effects on communities, including reduced retail demand and declining tax bases.30
bPersonal income includes all wages, employer-provided benefits, rental property, government benefits, and interest and dividends. It excludes capital gains from stocks. See U.S. Department of Commerce. Bureau of Economic Analysis. “Income & Saving.” Available at https://www.bea.gov/resources/learning-center/what-to-know-income-saving. Accessed December 2021 and on file with Food & Water Watch.
cEstimate uses the U.S. Census Bureau’s County Business Patterns data, which changed reporting in the 2017 report year to no longer include data cells with three or fewer businesses. We used 2016 data instead to have a more accurate comparison across the years.
Part 4:
The Factory Farm Industry Is Driving Climate Change
We need to support diverse family-scale farms
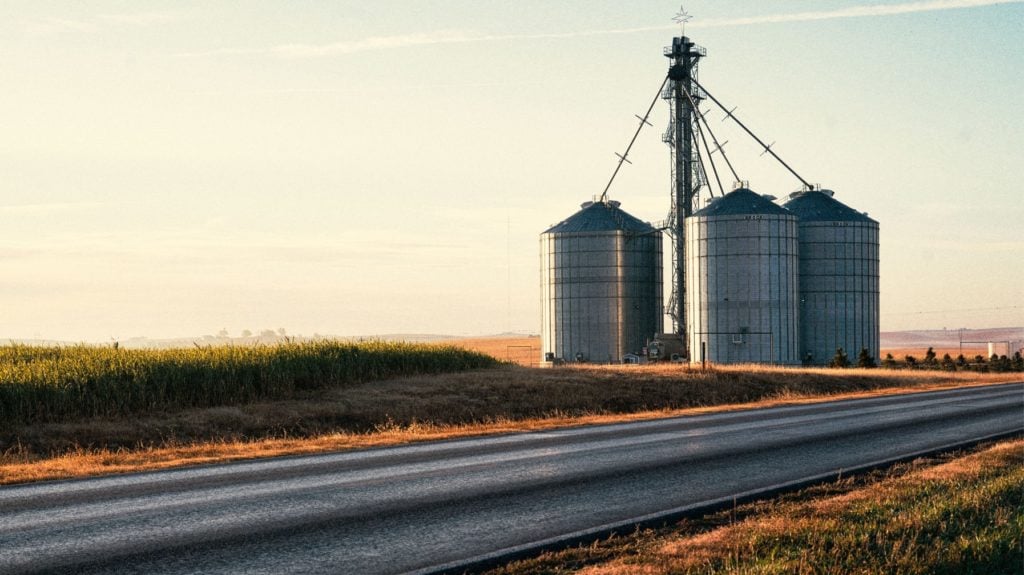
Derecho damage seen on a grain bin in Jackson County, Iowa Photo Credit: CC BY 2.0 / Phil Roeder / Flickr
Decoupling hog and crop production has had significant consequences for Iowa’s environment and the global climate. Previously, smaller and more diverse crop-and-livestock systems could only get so big, restrained in part by the amount of cropland that they could dedicate to growing feed. Smaller farms also produce less manure, which can be sustainably recycled onsite as fertilizer and thereby reduce chemical inputs on cropland.31
But artificially cheap feed and pressure from the pork industry have incentivized farms to expand their herds to previously unthinkable sizes. This creates a surplus manure problem, with many regions of the United States, including Iowa, producing more nutrients than can be sustainably recycled. These problems, compounded in regions with high densities of factory farms, contribute to runoff that pollutes soil and water.32 In 2021, American Rivers named Iowa’s Racoon River, which receives overflows from hundreds of factory hog operations, one of the country’s “Most Endangered Rivers.”33
RaCcOON RIVER
The Country’s Most Endangered Rivers: Raccoon River
American Rivers named Iowa’s Raccoon River one of the Most Endangered Rivers in the U.S. The Raccoon River supplies drinking water to over half a million Iowans. Des Moines Water Works, Iowa’s largest water utility, depends on the Raccoon River in order to provide residents of central Iowa with safe drinking water.
SCROLL SIDEWAYS TO NAVIGATE

RACcOON RIVER
But industrial agriculture practices are rampant in the watershed. Over 750 factory farms are located in the basin and have put our access to clean water at risk. In order to provide safe drinking water to residents in Iowa’s capital city of Des Moines, the Des Moines Water Works was forced to invest in one of the world’s most expensive nitrate removal systems — a cost borne by ratepayers, not the corporate agribusiness entities responsible for the pollution. Why?
RACcOON RIVER
Because E. coli, MRSA, and toxic levels of nitrates are as much a part of the water in Iowa as hydrogen and oxygen. Where are they coming from? These harmful pathogens and pollutants originate in factory farms. Each year, over 3,600 factory farms across the state produce more than 72 billion pounds of manure. That waste is then spread on acre after acre of cropland, oftentimes in amounts far greater than the soil’s ability to absorb it. From there, the excess runs off into Iowa’s waters, polluting drinking water, limiting recreation on the water, and destroying critical plant and animal habitat.
Factory farms decimate rural economies and rural life, a price no one should have to pay so that corporations can profit.
The unsustainable factory farm model is pushing our climate to the limit. Globally, livestock production contributes 14.5 percent of all human-sourced greenhouse gas emissions.34 Yet Iowa’s hog production continues to balloon, with processors profiting off this glut by expanding export markets.35 At a critical juncture where climate scientists are urging nations to reduce livestock production to sustainable levels, the pork industry is promoting U.S. pork abroad and exporting as much as one-third of all U.S. production.36
The factory farm model is propped up by a cropping system that similarly encourages overproduction.37 Crop farmers faced the same pressures to “get big or get out” in the 1970s and 80s38; in 2017, Iowa produced 65 percent more corn and 85 percent more soybeans compared to 1982, but on 40 percent fewer farms (Figure 9). This is a highly inefficient system, with the vast majority of corn bushels not directly feeding people but instead getting processed into livestock feed, ethanol and food additives.39 Corn and soybean production also contribute to climate change, given the huge amounts of land and fossil fuel-derived inputs they consume.40
Transitioning to smaller, diverse crop-and-livestock systems can curb overproduction and lessen Iowa’s ecological footprint.41 But these systems can only scale up once we have reformed the federal farm safety net to support family-scale operations and to incentivize sustainable practices. Corporate agribusinesses spend millions of lobbying dollars to keep the current polluting system in place.42 We cannot address these climate impacts without combating corporate power.
Part 5:
Conclusion and Recommendations
We cannot solve this crisis without combating corporate power
The factory hog industry is not delivering on its promises to Iowa’s rural economies. In fact, counties with the most hog production score lower across a range of social and economic indicators compared to counties with less hog production. This report complements a Food & Water Watch economic analysis that found that, as corporations tightened their hold on Iowa’s hog production, the value shared by rural communities declined.
As illustrated in our first report in this series, “The Grocery Cartels,” corporate consolidation is at the heart of our food system’s dysfunction. Lax attitudes towards antitrust, embraced by leaders on both sides of the aisle, created space for a handful of powerful corporations to amass power over each step of the food supply chain. The problem is too big for any single farmer or eater to solve; we need our elected leaders to stand up against corporate power.
Legislation for a just food system
First, we need a moratorium on new and expanding factory farms, to solve this crisis that worsens every passing year. Moratorium legislation has been introduced in the Iowa legislature for the past several sessions; federal legislation like the Farm System Reform Act would similarly stop factory farm expansion while funding a just transition for existing factory farms.43 In addition, we must halt agribusiness mergers and break up big conglomerates through comprehensive legislation like the Food and Agribusiness Merger Moratorium and Antitrust Review Act.44
But unravelling the factory farm model and transitioning to family-scale farms will take additional steps. We need to overhaul the federal farm safety net and steer U.S. Department of Agriculture (USDA) resources into smaller, diversified farms. Fortunately, we have this opportunity every five years, through omnibus legislation known as the Farm Bill. Here’s what we recommend:
Restore supply management in the next Farm Bill and ensure the programs benefit farmers of all backgrounds. The first Farm Bill was part of New Deal legislation, and a direct response to commodity overproduction that led to plummeting crop prices and drove many farms into foreclosure. This and other bills curbed overproduction, protected vulnerable cropland and guaranteed living wages for farmers who could access these programs.45
Here’s how supply management worked: The USDA would set a price floor for grains and provide loans based on this price floor, which farmers repaid after harvest. In years when market prices dropped below the price floor, the USDA collected the harvest as collateral, essentially buying surplus grains from the market for the federal grain reserve. Then, when drought or other disasters reduced crop yield, the USDA sold grains from the federal reserve into the market,46 smoothing out market volatility and ensuring a steady supply of grain to the benefit of both farmers and consumers.
Remarkably, supply management can operate at virtually no budgetary cost to taxpayers.47 We can reinstate supply management for grain crops and extend it to dairy — while ensuring participation by farmers of all backgrounds.
Reform — rather than remove — the current farm safety net. Immediately ending current farm subsidy programs would only drive more farmers off the land. Instead, we can realign these programs with the climate reality while moving toward a system that actually manages production. Participants in programs like federal subsidized crop insurance should be required to implement organic regenerative practices such as crop rotation or reduced pesticide reliance. We must also ban factory farms from receiving public funding from conservation programs and guaranteed loans.
Expand coverage for more crops that directly feed people. Feed corn, soybeans and cotton make up a huge chunk of acreage enrolled in federal crop insurance programs,48 while many fruits, vegetables and nuts are not eligible under many programs.49 Expanding safety net coverage to more specialty crops can help more farmers shift to new production systems.
Corporate interests have fought against supply management and other common-sense farm policies that would bring prosperity to rural America. They spend hundreds of millions of dollars lobbying each year for the current agricultural system that serves their corporate interests, all while claiming that they support the family farm.50 But the COVID-19 pandemic revealed whose side they are really on — and their total disregard for workers’ lives. We must elect leaders who are willing to stand up to these hog bosses and other agribusinesses. Only then can we pass a fair Farm Bill and reshape our food system so that it works for all farmers, food chain workers and eaters.
Part 6:
Methodology
Food & Water Watch compiled data from the U.S. Census of Agriculture, a comprehensive analysis of U.S. farms released every five years. We pulled data on the number of hogs sold and the number of hog farms in each Iowa county, for census years spanning 1982 through 2017. We also used the Census of Agriculture to estimate historical yields and prices for corn and soybeans.
For each census year, we sorted counties into quartiles by the total number of hogs sold. The top 50 counties were designated “high hog sale” counties, and the bottom 49 “low hog sale” counties. We used the same method to distinguish “large hog farm” and “small hog farm” counties, based on the average number of hogs sold per farm. This enabled us to compare economic outcomes between counties that saw the most factory farm development and those that saw the least. We created a third comparison based on population density (50 most-rural / 49 least-rural), using data compiled from the U.S. Census Bureau, providing a way to tease out the impacts of population density on the various economic outcomes.
The Census of Agriculture withholds county-level data on livestock numbers when there are only a handful of farms reporting, to protect farm identity. In these instances, we summed the available county-level data on hogs for a particular year and subtracted this by the state-level data to find the residual difference. We then divided this difference by the total number of farms in all counties with undisclosed data to generate a residual average. We multiplied this residual average by the number of farms in counties with undisclosed data, to derive an approximation. This method was repeated in various census years as needed.
We used many of the same economic indicators found in our 2012 report, matching the years with those of the Census of Agriculture (1982, 1987, 1992, 1997, 2002, 2007, 2012 and 2017) or the nearest approximate. We estimated total retail establishments using data from the Iowa Department of Revenue. Retail establishments by industry come from the U.S. Census Bureau’s County Business Patterns. We used NAICS (North American Industry Classification System) data starting in census year 2002, and SIC (Standard Industrial Classification) codes for all earlier releases, matching with the closest approximation (i.e., NAICS 4451 “Grocery Stores” and SIC 541 “Grocery Stores”; NAICS 311611 “Animal (except Poultry) Slaughtering” and SIC 2011 “Meat Packing Plants”; NAICS 311612 “Meat Processed from Carcasses” and SIC 2013 “Sausages and Other Prepared Meat Products”).
The U.S. Census Bureau’s American Community Survey provided data on population, county landmass in square miles and median household income. Personal and farm income, and wage jobs, came from the U.S. Department of Commerce’s Bureau of Economic Analysis. We converted all monetary data into January 2020 dollars using the Consumer Price Index (CPI) Inflation Calculator provided by the Bureau of Labor Statistics.
Congress needs to know you support a transition to diverse, family-scale farms. Will you send them a message?
Endnotes
- Decision Innovation Solutions. Prepared for Iowa Pork Producers Association. “2020 Iowa Pork Industry Report.” May 2020 at 6; Sexton, Richard. “Market power, misconceptions, and modern agricultural markets.” American Journal of Agricultural Economics. Vol. 95, Iss. 2. January 2013 at 6 to 7.
- Clark, E. Ann. “Benefits of re-integrating livestock and forages in crop production systems.” Journal of Crop Improvement. Vol. 12, Iss. 1-2. 2004 at 3 to 5; Ayazi, Hossein and Elsadig Elsheikh. Haas Institute for a Fair and Inclusive Society. “The US Farm Bill: Corporate Power and Structural Racism in the United States Food System.” October 2015 at 26 to 27.
- Rasmussen, Wayne D. et al. U.S. Department of Agriculture (USDA). Economic Research Service (ERS). “A Short History of Agricultural Adjustment, 1933-75.” Agriculture Information Bulletin No. 391. March 1976 at 3 to 4; Reynolds, Bruce J. USDA. “Black Farmers in America, 1865-2000: The Pursuit of Independent Farming and the Role of Cooperatives.” RBS Research Report 194. October 2002 at 8 to 9.
- McGranahan, Devan A. et al. “A historical primer on the US farm bill: Supply management and conservation policy.” Journal of Soil and Water Conservation. Vol. 68, No. 3. May/June 2013 at 68A to 70A; Ayazi and Elsheikh (2015) at 23 to 26.
- Olson, Allen H. “Federal farm programs — past, present and future — Will we learn from our mistakes?” Great Plains Natural Resources Journal. Vol. 6, No. 1. 2001-2002 at 13 to 16; Freese, Betsy. “How contract feeding changed the hog industry.” Successful Farming. November 25, 2019.
- Ayazi and Elsheikh (2015) at 26 to 27; Clark (2004) at 3 to 5.
- Decision Innovation Solutions (2020) at 29.
- USDA. Grain Inspection, Packers and Stockyards Administration. “2008 Annual Report.” March 1, 2009 at 46; USDA. Agricultural Marketing Service. “Packers and Stockyards Division: Annual Report 2019.” August 2020 at 9.
- Sexton (2013) at 2; Food & Water Watch (FWW) analysis of National Pork Board. “Pork Facts: The Pork Industry at a Glance.” 2009-2012.
- Lawrence, John D. “Hog marketing practices and competition questions.” Choices. Vol. 25, No. 2. 2nd Quarter 2010 at 2 to 3.
- Ajewole, Kayode et al. “Price reporting in a thin market.” Journal of Agricultural and Applied Economics. Vol. 48, No. 4. November 2016 at 347 to 348 and 361 to 362; Willingham, Zoe and Andy Green. Center for American Progress. “A Fair Deal to Farmers: Raising Earnings and Rebalancing Power in Rural America.” May 2019 at 16 to 19.
- Lawrence (2010) at 2 to 3 and 5; Sexton (2013) at 6 to 7; MacDonald, James et al. USDA ERS. “Contracts, Markets, and Prices.” Agricultural Economic Report No. 837. November 2004 at 41.
- Ajewole et al. (2016) at 345 to 347.
- Ibid.; Lawrence (2010) at 4; MacDonald et al. (2004) at 50 to 52.
- Willingham and Green (2019) at 20.
- USDA ERS. “Pork values and spreads.” Available at https://www.ers.usda.gov/data-products/meat-price-spreads. Accessed August 2021.
- Decision Innovation Solutions (2020) at 42, figure 38.
- FWW. “The Economic Cost of Food Monopolies.” 2012.
- National Pork Producers Council (NPPC). “Pork facts.” Available at https://nppc.org/pork-facts. Accessed November 2021 and on file with FWW.
- Missouri Census Data Center. “All about measures of income in the Census.” Available at https://mcdc.missouri.edu/help/measures-of-income. Accessed December 2021 and on file with FWW.
- NPPC. “Pork facts”; NPPC. [Press release]. “New economic impact study on livestock rule means rural job losses & higher meat prices.” October 21, 2010.
- Swenson, Dave. Iowa State University and University of Iowa. Prepared for Niman Ranch. “The Economic Contribution of Niman Ranch Hog Production in Iowa.” March 2021 at 6, table 1 and 10.
- Decision Innovation Solutions (2020) at 61.
- Andrews, David and Timothy J. Kautza. Pew Commission on Industrial Farm Animal Production. “Impact of Industrial Farm Animal Production on Rural Communities.” 2008 at v to vi; Donham, Kelley J. et al. “Community health and socioeconomic issues surrounding concentrated animal feeding operations.” Environmental Health Perspectives. Vol. 115, No. 2. February 2007 at 317; Foltz, Jeremy D. et al. “Do purchasing patterns differ between large and small dairy farms? Econometric evidence from three Wisconsin communities.” Agricultural and Resource Economics Review. Vol. 31, No. 1. April 2002 at 37; Swenson (2021) at 9.
- Kelsey, Timothy W. et al. Pennsylvania State University. College of Agricultural Sciences. “Not Inconsequential: The Economic Effect of Small Farms in Pennsylvania, 2017.” 2021 at 5 to 9.
- Decision Innovation Solutions (2020) at 26.
- MacDonald, James M. et al. USDA ERS. “Consolidation in U.S. Meatpacking.” AER-785. February 2000 at 14 to 15; Fitzgerald, Amy J. “A social history of the slaughterhouse: From inception to contemporary implications.” Research in Human Ecology. Vol. 17, No. 1. 2010 at 62 to 64.
- U.S. Department of Labor. Bureau of Labor Statistics. 2020 Survey of Occupational Injuries and Illnesses. Available at https://www.bls.gov/iif/soii-data.htm#newsrelease.
- FWW. “Fact-checking Smithfield’s coronavirus food shortage BS.” April 22, 2020.
- McGranahan, David et al. USDA ERS. “Nonmetropolitan Outmigration Counties.” Economic Research Report No. 107. November 2010 at 2.
- Clark (2004) at 8, 19 and 24.
- Yang, Qichun et al. “Spatiotemporal patterns of livestock manure nutrient production in the conterminous United States from 1930 to 2012.” Science of the Total Environment. October 2015 at 14 to 20; Kellogg, Robert L. et al. USDA. Natural Resources Conservation Service and ERS. “Manure Nutrients Relative to the Capacity of Cropland and Pastureland to Assimilate Nutrients: Spatial and Temporal Trends for the United States.” Nps00-0579. December 2000 at executive summary, 1 and 89 to 92.
- Jones, Chris et al. “The urgent need to address nutrient imbalance problems in Iowa’s high-density livestock regions.” Agricultural Policy Review. Fall 2019 at discussion; Food & Water Action. “American Rivers has named Iowa river ‘Most Endangered’ in the country.” April 13, 2021.
- Gerber, P.J. et al. (2013). “Tackling Climate Change Through Livestock: A Global Assessment of Emissions and Mitigation Opportunities.” Rome: Food and Agriculture Organization of the United Nations at xii.
- USDA. Foreign Agricultural Service. “2020 United States Agricultural Export Yearbook.” 2021 at 1 to 2; Holcomb, Griffin. IBISWorld. “Meat, Beef & Poultry Processing in the US.” Industry Report No. 31161. March 2021 at 11, 14 and 20 to 21.
- Schiermeier, Quirin. “Eat less meat: UN climate-change report calls for change to human diet.” Nature. Corrected August 12, 2019; U.S. Meat Export Federation. “U.S. pork exports soared to new value, volume records in 2019.” National Hog Farmer. February 6, 2020.
- Smith, Trevor J. “Corn, cows, and climate change: How federal agricultural subsidies enable factory farming and exacerbate U.S. greenhouse gas emissions.” Washington Journal of Environmental Law & Policy. Vol. 9, Iss. 1. March 2019 at 47 to 48 and 55.
- McGranahan, Devan A. et al. (2013) at 69A to 71A.
- FWW analysis of USDA. National Agricultural Statistics Service. Quick Stats. Available at https://quickstats.nass.usda.gov. Accessed July 2020; “Sweet corn vs. field corn: What’s the difference?” La Crosse Tribune. October 16, 2015.
- Koneswaran, Gowri and Danielle Nierenberg. “Global farm animal production and global warming: Impacting and mitigating climate change.” Environmental Health Perspectives. Vol. 116, No. 5. May 2008 at 579.
- Clark (2004) at 11 to 13.
- Ayazi and Elsheikh (2015) at 26 to 27 and 34.
- Cadloff, Emily Baron. “Iowa representative pushing to ban new factory farms.” Modern Farmer. February 10, 2022; S. 3221. 116th Cong. (2019).
- S. 1596. 116th Cong. (2019).
- Rasmussen et al. (1976) at 3 to 5; Reynolds (2002) at 8 to 9.
- Graddy-Lovelace, Garrett and Adam Diamond. “From supply management to agricultural subsidies — and back again? The U.S. Farm Bill & agrarian (in)viability.” Journal of Rural Studies. Vol. 50. February 2017 at 76.
- Ibid at 76; McMinimy, Mark A. Congressional Research Service (CRS). “U.S. Sugar Program Fundamentals.” R43998. April 6, 2016 at summary.
- Shields, Dennis A. CRS. “Federal Crop Insurance: Background.” R40532. August 13, 2015 at summary; Schnepf, Randy. CRS. [Fact sheet]. “2018 Farm Bill primer: Marketing Assistance Loan program.” IF11162. April 3, 2019 at 2.
- Rosa, Isabel and Renée Johnson. CRS. “Federal Crop Insurance: Specialty Crops.” R45459. Updated January 14, 2019 at 9; Smith (2019) at 43 to 44.
- Ayazi and Elsheikh (2015) at 15; Open Secrets. “Sector profile: Agribusiness.” Available at https://www.opensecrets.org/federal-lobbying/sectors/summary?id=A. Accessed December 2021 and on file with FWW; Duvall, Zippy. American Farm Bureau Federation. “Your voice is essential to our country’s success.” July 21, 2021.