Help Us Pass Federal Farm Legislation!
What You’ll Learn From This Report
- 1: We Must Stop Pretending Renewables Will Automatically Displace Fossil Fuels
- Only curbing fossil fuels will let renewables deliver on their potential.
- 2: Renewables and Fossil Fuels Have Grown Together
- Renewable energy is not a silver bullet for eliminating fossil fuels.
- 3: Emphasizing Renewables Alone Will Not Displace Fracking
- Waning consumer demand for fracked gas means frackers turn to exports, industrial uses.
- 4: Corporations and Democrats Continue Trump’s Energy Agenda
- The “all of the above” approach prevents us from curbing the climate crisis.
- 5: Cozy State Regulators Will Not Choose Renewables Over Fossil Fuels Unless They Have To
- Loopholes help fossil fuels compete against renewables.
- 6: Leaders Must Directly Confront Fossil Fuel Production and Use
- Supply-side energy policy is crucial for our future.
Part 1:
We Must Stop Pretending Renewables Will Automatically Displace Fossil Fuels
Only curbing fossil fuels will let renewables deliver on their potential.
Leaders of the United States are at a make-or-break crossroads. As the climate rapidly deteriorates and the impacts multiply from climate-amplified disasters — such as fires, drought, hurricanes and floods — we have a waning chance to avert the worst-case scenarios of climate chaos. It will require bold action and directly taking on the fossil fuel industry.
The science behind climate change is undeniable, and with each passing day more policy makers agree that action is required. The only real debate that remains is how to address this challenge.
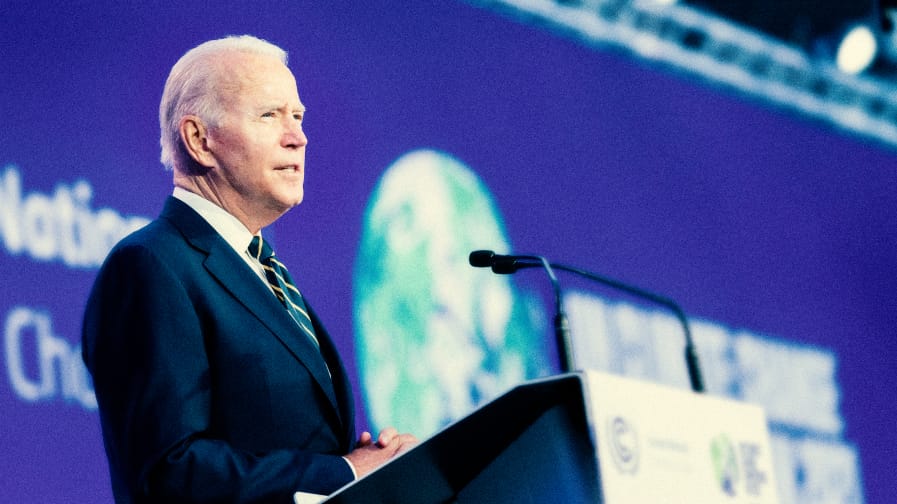
There is a growing consensus that we must drastically increase the production of renewable energy, and policy makers — including President Biden — have embraced broad goals for a large percentage of electricity to come from renewable energy by 2030.1 However, these goals will fall short in addressing the climate emergency if increases in renewable energy are not coupled with immediate action to curb the production and use of fossil fuels.2
Curbing Greenhouse Gas Emissions Changes Our Future
The climate policies we enact by 2030 affect how much our climate warms by 2100.
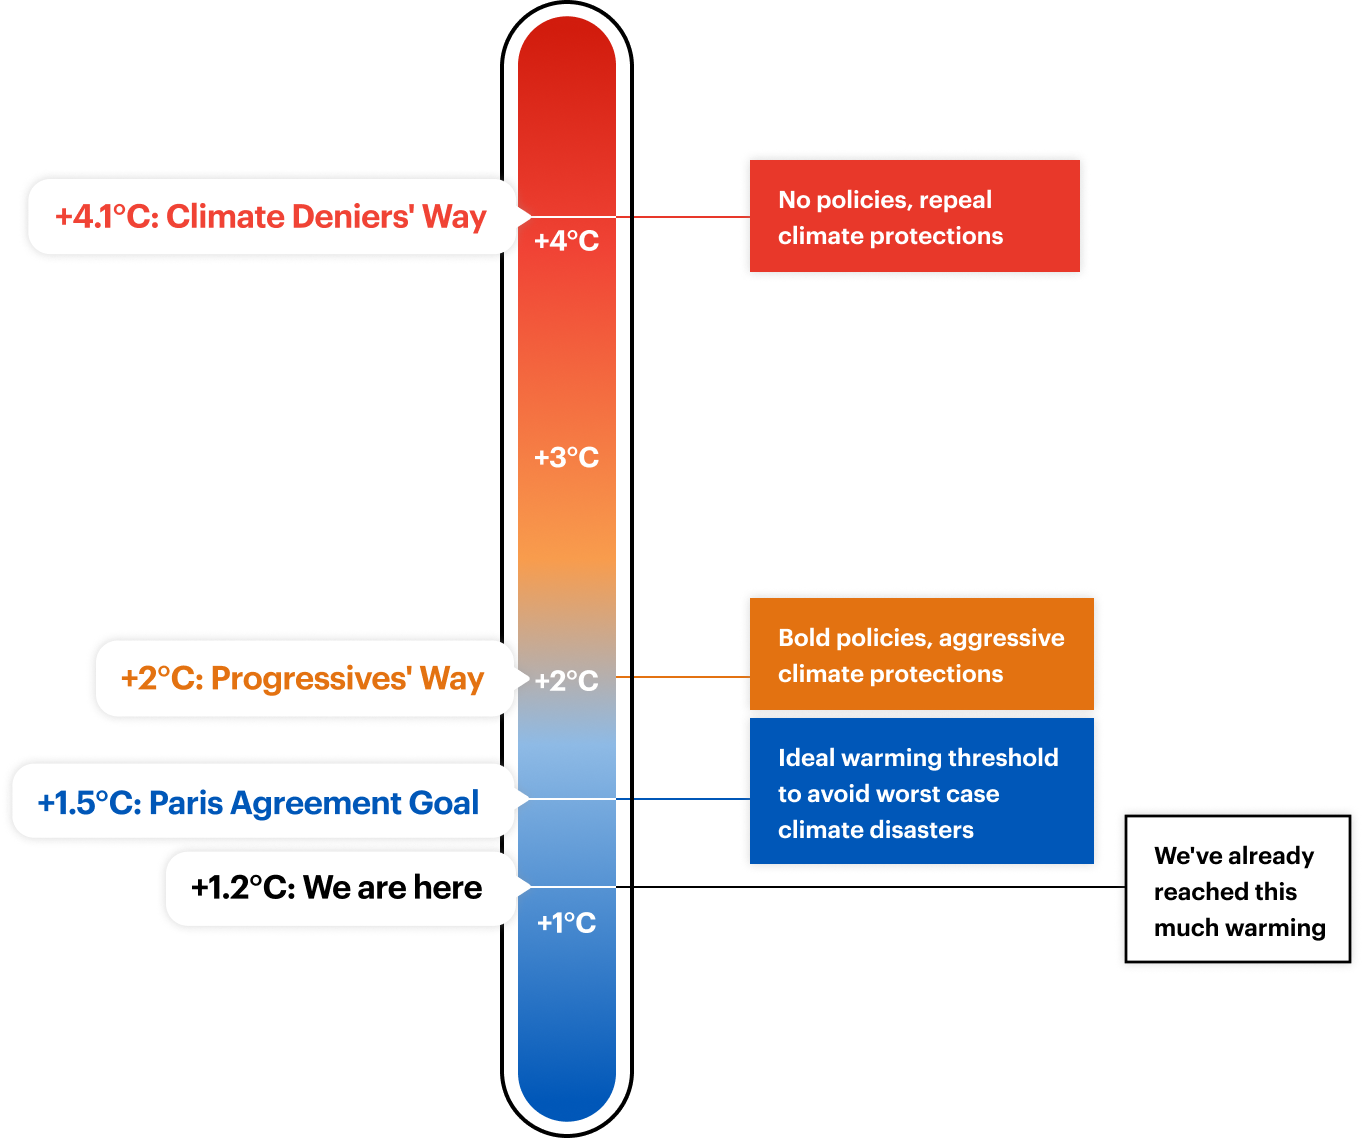
Source: Graphic based on projections for warming over pre-industrial levels, from OurWorldInData.org.
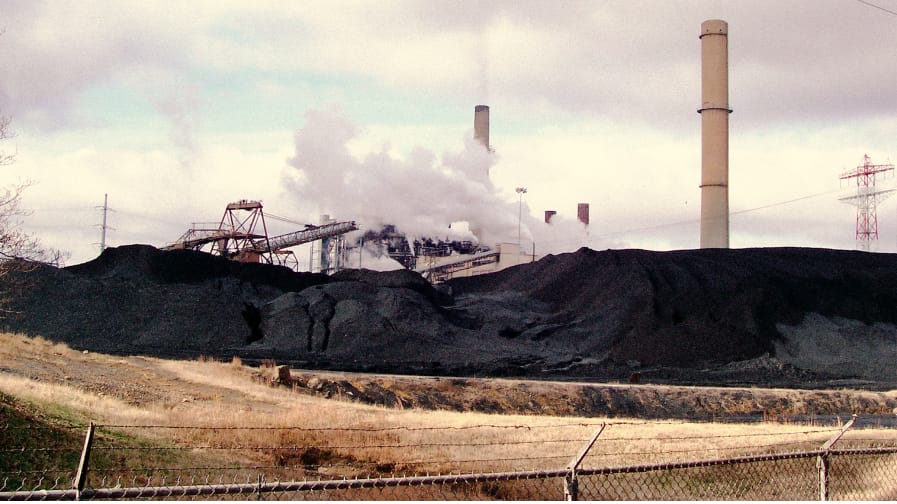
The policy decisions of the past decade drove a boom in hydraulic fracturing (“fracking”), resulting in a massive buildout of fracked gas power plants, pipelines and petrochemical facilities. Fossil fuel corporations plan to build even more. Natural gas currently accounts for more than three times as much electricity production as renewable energy.3 Alarmingly, the U.S. Energy Information Administration (EIA) projects that the United States will consume more fracked gas in 2050 than 2020.4 This is a recipe for disaster.
We do not have a decade or even a few years to test the idea that simply by building up renewable energy, the market will phase out the production of fossil fuels. History shows that even when renewable energy has increased, it has not significantly impacted fossil fuel production. For example, only 34 percent of the fracked gas is burned to produce electricity — meaning that most fracked gas is not even supporting our electric grid.5 To address our climate crisis, we need to thwart climate change’s main driver: fossil fuels.
President Biden and many elected leaders use catchy soundbites about moving off of fossil fuels, but the policies that they embrace (including false solutions such as carbon capture, “blue” hydrogen and offsets) will lock us in to dependence on fossil fuels for decades. Despite Biden’s promises to tackle climate change, and the iron-clad science that says we must stop approving new fossil projects, the administration has greenlit even more of them.6
Hundreds of leading scientists stated in an October 2021 letter to President Biden that “the reality of our situation is now so dire that only a rapid phase-out of fossil fuel extraction and combustion can fend off the worst consequences of the climate crisis.”7 Their urgency was mirrored in the 2021 report from the United Nations’ Intergovernmental Panel on Climate Change. Following the report’s release, the UN Secretary-General said:
“This report must sound a death knell for coal and fossil fuels, before they destroy our planet. There must be no new coal plants built after 2021…. Countries should also end all new fossil fuel exploration and production, and shift fossil fuel subsidies into renewable energy.”8
We still have time to fix our future, but the hour is getting late. We are already experiencing significant climate impacts, but we can and must act now to avoid truly catastrophic consequences. We are at a crossroads that will either haunt our future or redeem it. Policy makers can keep catering to the fossil fuel industry and condemn us to runaway climate chaos, or we can boldly reverse course, act for the benefit of humanity and take the necessary steps to end fossil fuels. As a society, the choice is ours.
Part 2:
Renewables and Fossil Fuels Have Grown Together
Renewable energy is not a silver bullet for eliminating fossil fuels.
Renewable Energy Is Ready to Take Center Stage
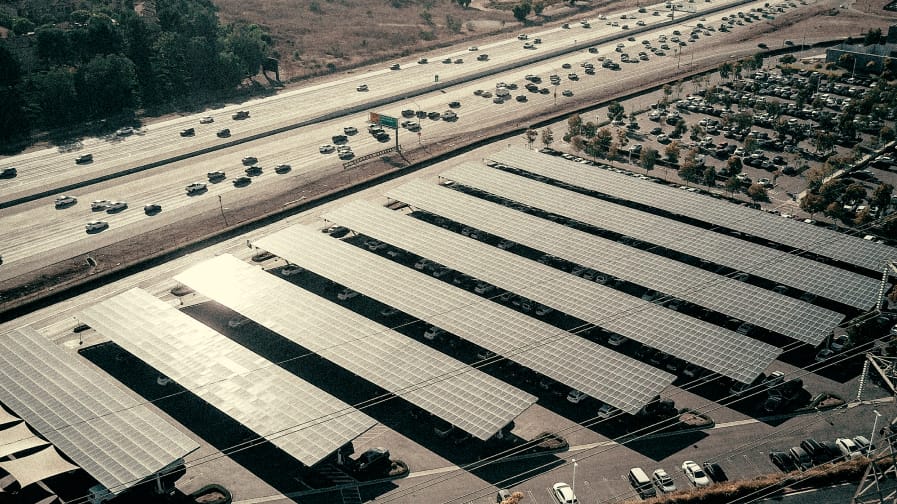
The need for urgent climate action becomes more pressing daily, and fortunately renewable energy options are cheaper than ever. Across their lifetimes, solar and wind energy projects cost $36.50 and $40 per megawatt-hour, respectively, in 2020, down from $248 and $123.50 per megawatt hour just over a decade earlier.9 These levelized costs are far cheaper than generating electricity from new nuclear or coal power plants and are often cheaper than natural gas plants.10 Over the past decade, cost reductions and public policy have more than quadrupled the share of electricity generated by wind and solar.11
Moreover, advances in storage and reliability technologies have torpedoed the fossil fuel industry’s claim that 100 percent renewable energy is not possible because “the wind doesn’t always blow and the sun doesn’t always shine.” Scientific advances now mean that off-the-shelf, commercially available technology could support a power grid without any fossil fuels.12
Renewable energy’s potential has been demonstrated at scale in the real world. In 2019, a literature review of 180 scholarly papers covering the challenges associated with 100 percent (or near 100 percent) renewable systems concluded that most systems studied are technically and economically feasible.13 Moreover, when combining renewable technologies with storage, modeling shows that “enough renewable baseload potential exists across the US to meet the current electricity demand ten times over.”14
Fossil Fuel Investment and Production Still Boom
While the trends and viability of renewable energy provide reason for hope, without immediate climate action, the powerful and tenacious fossil fuel industry will doom any hope for climate stability. Despite remarkable progress in renewable electricity, the United States continues to produce and consume large quantities of fossil fuels.
Amid the coronavirus pandemic, U.S. fossil fuel production fell somewhat in 2020 from an all-time high in 2019 (Figure 1). But according to EIA projections, fossil fuel production is poised to resume its rise through 2022.15 Although coal production has fallen by about half during the fracking boom, the increased production of oil and natural gas has more than offset any greenhouse gas reductions that occurred during coal’s decline.16 If these trends continue, the long-term outlook for the climate is dire. The EIA’s latest long-term projections predict that the U.S. will consume more oil and natural gas in 2050 than in 2020.17

How has U.S. fossil fuel production grown so quickly?
The massive expansion in U.S. fossil fuel production has been enabled primarily by the environmentally destructive practice of shale gas development through hydraulic fracturing (“fracking”). Proponents of fracking misleadingly claim that fracked gas is a “bridge fuel” to move us from traditional fossil fuels such as oil and coal to renewable energy like wind and solar. But this bridge has led only to more fossil fuel dependence, locking us in to decades of worsening climate chaos.
Communities plagued by fracking have experienced well-documented and severe environmental impacts.18 These harms fall disproportionately on frontline communities that are more likely to be rural, lower income and/or communities of color.19 In addition to known environmental and public health consequences, fracked gas production is associated with significant leaks of methane.
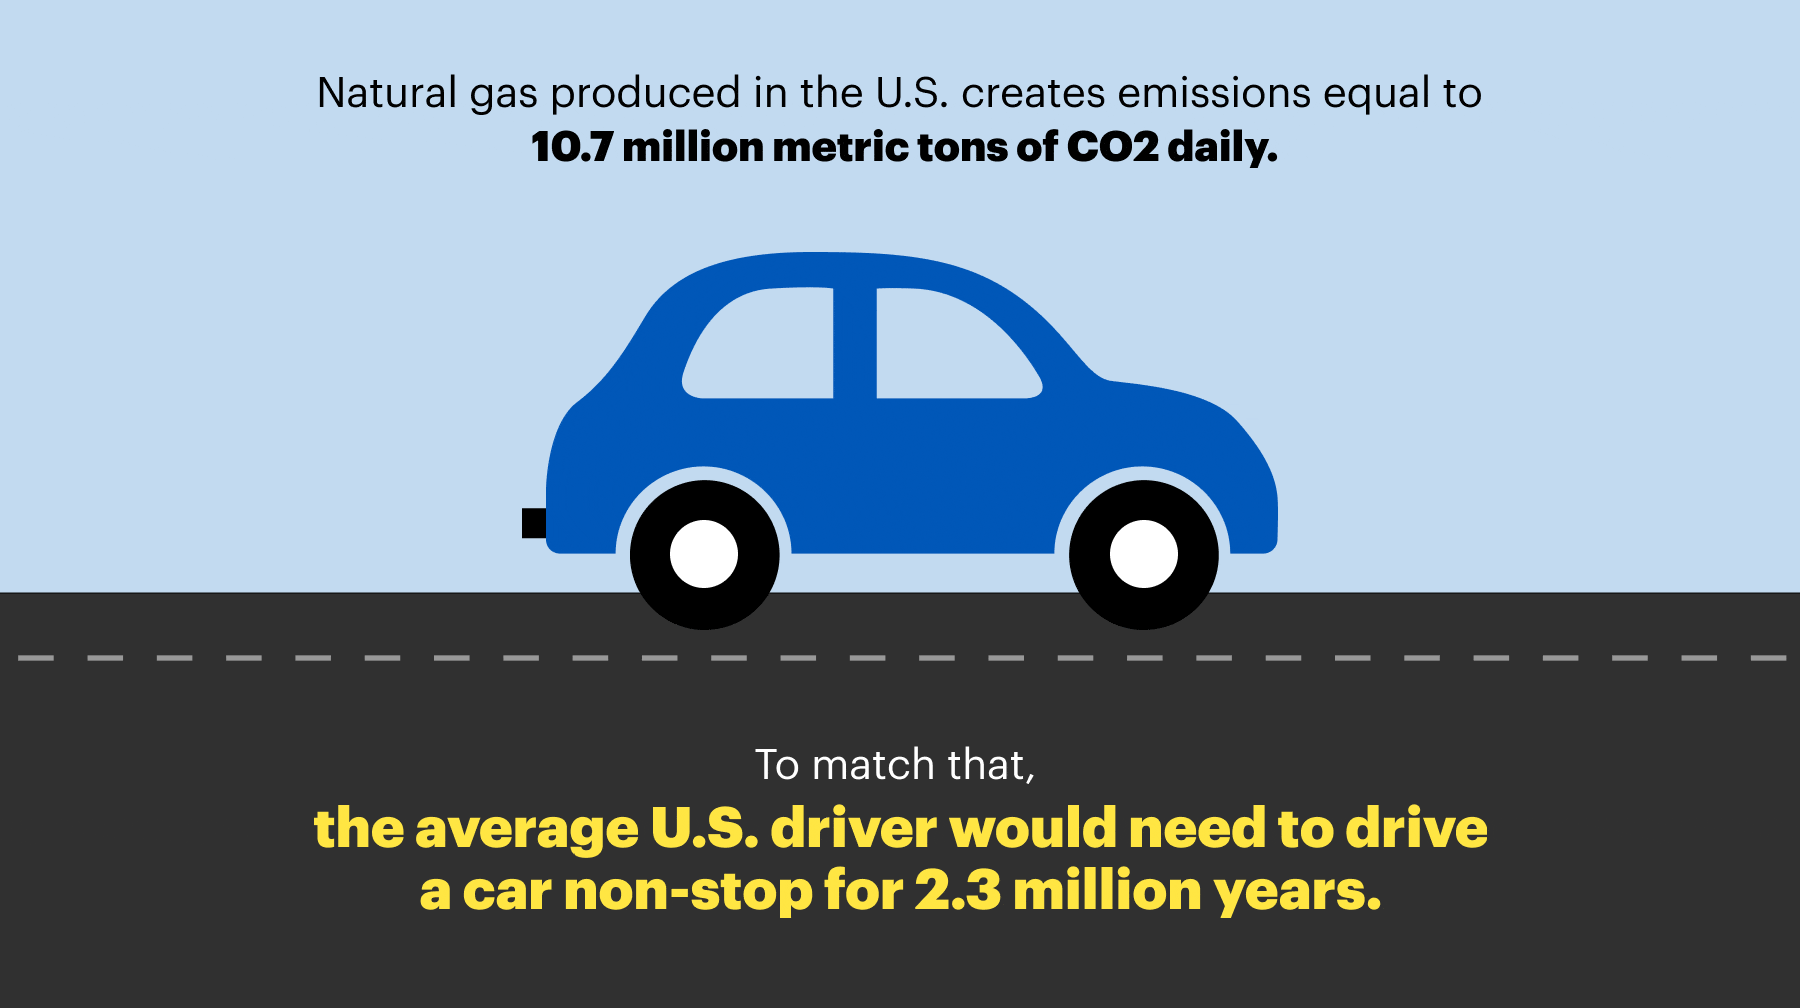
Fracked gas production grew more than five-fold between 2010 and 2019, reaching 75.28 billion cubic feet per day in May 2021, or around 82 percent of all gas produced in the United States.20 The climate consequences of this natural gas glut are staggering. Natural gas produced in the country is responsible for emissions equivalent to 10.7 million metric tons of carbon dioxide each day; to match these daily emissions, the average American would need to drive a car non-stop for 2.3 million years.21
PROVED RESERVES
Progress in Fossil Fuel Technology Could Doom Our Climate
Without supply constraints such as banning natural gas and oil production, there is no guarantee that fossil fuel use will end or even slow. Unfettered technological progress is likely to unlock an ever-growing supply of fossil fuels at lower prices.22
SCROLL SIDEWAYS TO NAVIGATE

PROVED RESERVES
Total resources unlockable by technological improvements vastly outnumber these proved reserves (a metric used in mining that describes the amount of hydrocarbon resources that can be obtained from a site with a reasonable level of certainty). For example, if the production of oil shale (an oil-rich sand similar to bitumen tar sands, not to be confused with shale oil) became economical, it would at least triple proved reserves, and technology to extract methane hydrates (crystalized methane deep in the ocean) could more than double current gas reserves.23
PROVED RESERVES
New environmentally destructive extraction methods could continue to unlock new sources of oil and gas. Currently, technological progress is finding new hydrocarbons faster than consumption is depleting existing sources. Proved reserves of oil and natural gas in the United States more than doubled between 2005 and 2018 despite high rates of extraction. In 2018, proved reserves totaled 504 trillion cubic feet of gas and 47 billion barrels oil.24 If extracted and burned, these reserves would release the equivalent of 78.7 billion metric tons of CO2.25 These reserves alone contain 15 years’ worth of U.S. energy-related greenhouse gas emissions.26
Part 3:
Emphasizing Renewables Alone Will Not Displace Fracking
Waning consumer demand for fracked gas means frackers turn to exports, industrial uses.
A single-minded focus on the promotion of renewable electricity, without addressing fossil fuel use in other sectors, will fail to adequately address climate change. Only 34 percent of the natural gas produced in the United States is burned at power plants. Buildings and industrial users each account for about 25 percent of natural gas use, and the remaining 17 percent of natural gas is exported (Figure 2).27
Even in the context of electricity, the promotion of renewables has done little to check the rise of new natural gas power plants supplying the grid. Since 2010, the contribution of renewable energy to the grid has risen from 2.8 percent to 11.5 percent (Figure 3). At this rate, the United States would only reach 100 percent renewable electricity by 2130.28
However, the main trend in the electricity sector has been a substantial shift to natural gas. Natural gas grew from supplying 22.7 percent of electricity in 2010 to supplying 39.3 percent in 2020.29 This was the result of building more than 1,100 new natural gas generators with combined nameplate capacity greater than 100,000 megawatts (about 9 percent of all power plant capacity, or enough to power around 100 million homes if running at maximum).30 These new gas plants are intentionally designed with lifespans of 40 to 50 years.31 Without new policy, natural gas plants are likely to represent 40 percent of the new electric generation built through 2050, with even more gas plants opening through mid-century.32
Buildings Continue to Use Dangerous and Outdated Natural Gas Appliances
Natural gas is used for air and water heating in 9.7 percent of commercial buildings and 14.6 percent of residential buildings in the United States.33 This use (for air and water heating) could be displaced by readily available electric alternatives, as technologies that enable full electrification eliminate the need for natural gas in buildings.34 However, current trends indicate that without policy changes, natural gas use in buildings is unlikely to end. Natural gas appliances emit dangerous pollutants such as particulate matter, nitrous oxides, carbon monoxide and formaldehyde, which are linked to respiratory illness and cardiovascular disease. Operating a gas-powered stove and oven for an hour can raise indoor pollution to levels that exceed national air quality standards.35

Long-term climate goals cannot be reached without electrification.36 Despite this, the current pace of electrification in buildings is nowhere near fast enough. Buildings have slow turnover, and owners are often reluctant to invest in retrofits. Full electrification would likely require stringent standards for new buildings combined with rolling retrofit requirements for existing buildings.37 Deep reductions in buildings’ energy use are unlikely without the mandated retrofitting of the existing building stock.38 While constructing new buildings without natural gas should be the easier task, natural gas companies have fought tooth and nail against modest measures to limit the supply of natural gas to newly constructed buildings.39
Fracking’s Petrochemical and Plastics Push
The slow-changing buildings industry, while providing a stable outlet for entrenched natural gas companies, is not large enough on its own to support the continued fracking boom. The two sectors that are best positioned to enable the ongoing rise in natural gas production are exports and industrial users.40
The use of natural gas in the industrial sector is booming. Bulk chemicals (the production of organic and inorganic chemicals, resins and agricultural chemicals) account for half of this new industrial demand, including as feedstock (for hydrogen, methanol and nitrogenous fertilizer) as well as for heating purposes. Refineries, as well as producers of paper and bulk chemicals, also use natural gas for process heating and electricity generation, often at combined heat and power (CHP) plants.41
In February 2021, the main industry group representing petrochemical companies noted nearly 350 petrochemical projects that were planned, under construction or completed were made possible as a result of fracking.42 The EIA anticipates that the use of natural gas as a feedstock and a heating source in the industrial sector will grow substantially over the next decade.43
What is fracking’s link to plastic?
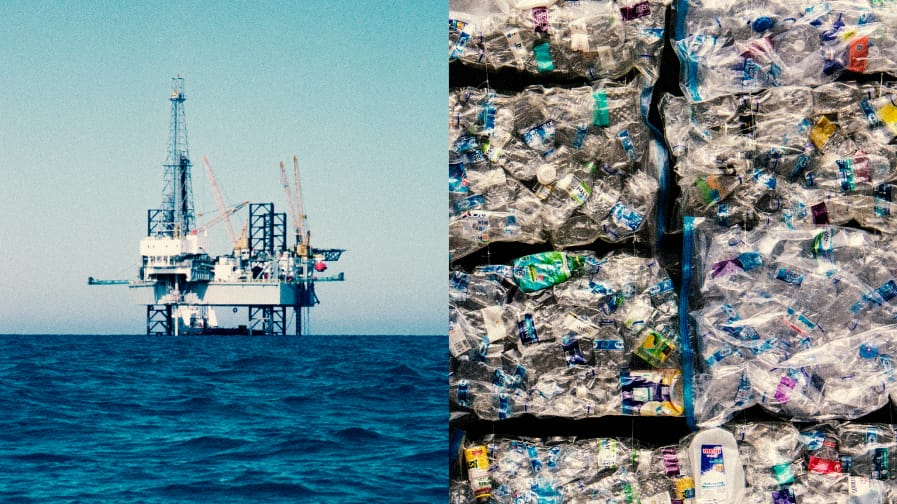
Fracking has unlocked a glut of ethane, a key petrochemical building block for plastics. In January 2020, the United States produced twice as much ethane as a decade earlier, sending growing quantities of ethane to domestic petrochemical plants and exporting it overseas.44 Ethane production is set to grow faster than other fossil fuels, buoyed by the fleet of new U.S. petrochemical plants.45 This additional petrochemical manufacturing will compound the local pollution generated by existing large facilities, disproportionately affecting marginalized communities.46
The petrochemical boom is ramping up plastics production, generating not only industry profits but also mountains of plastic waste. More than half of the new raw plastic resins produced in the United States are slated to be shipped overseas to be turned into plastic products.47 The majority of the packaging manufactured by the plastics industry involves materials that are immediately thrown away.48 Globally, on average, a person discards 110 pounds of plastic annually.49 Of the 18.3 trillion pounds of plastics produced since 1950, only around 9 percent have been recycled — meaning that more than 16 trillion pounds have been tossed into landfills, littered in the environment or incinerated.50 In addition to the environmental impacts of plastic waste, plastic production was responsible for 4 percent of global emissions in 2015.51
Exporting Natural Gas: A Booming Industry
U.S. energy production hit record highs in 2018 and 2019.52 Because of the pandemic, among other things, consumption of natural gas is set to decline slightly through 2022.53 However, after a brief decline, U.S. production of natural gas is accelerating,54 mostly because of the amount being sent to other countries. The EIA projected that natural gas exports would rise from 14.4 billion cubic feet per day in 2020 to 18.3 billion cubic feet per day by the end of 2021 (equal to nearly 20 percent of total U.S. natural gas production). This new export volume would more than compensate for a slight dip in the domestic use of natural gas for electricity, keeping producers flush.55
Of this increase in exports, 80 percent will be filled by fracked gas from newly drilled wells — gas that otherwise would have remained underground.56 Some natural gas is exported by pipeline or truck to Mexico and Canada, and the rest is shipped by tanker from export terminals to reach overseas markets.57 The gas moving via tankers first gets converted into liquefied natural gas (LNG), and its transport is highly dangerous.
Why is LNG so dangerous?
Natural gas is almost impossible to ship in its gaseous state. Super-cooling natural gas converts it to a liquid that takes up 600 times less volume, making it possible to load the liquefied natural gas (LNG) onto tankers. When unloaded, the LNG is heated to return it to a gas.58
When LNG is stored in tanks, the vastly different air and storage temperatures lead to pressure buildup and require venting to release or “boil-off-gas.”59 At some facilities, super-cold LNG is stored in tanks with only a single inner shell capable of withstanding the extreme temperature of the gas.60 Observed leak rates are as high as 10 percent, which more than offsets any climate advantage of natural gas relative to coal combustion.61
The tankers and storage facilities also pose significant risks of potentially catastrophic explosions. In 2014, a pipeline explosion at a Washington state LNG terminal sent shrapnel flying into a 14.6 million gallon storage tank, causing it to leak.62 The accident injured five workers, forced the evacuation of 1,000 residents within a two-mile radius and caused $72 million in property damage.63 In 2004, an LNG explosion at the terminal in Skikda, Algeria killed 30 people and flattened port infrastructure.64
U.S. LNG exports rose to record levels by the end of 2020, averaging 9.8 billion cubic feet per day in December.65 Existing LNG export capacity supports exporting as much as 10.1 billion cubic feet per day, but facilities that are currently approved and under construction would expand that capacity to 42.1 billion cubic feet per day, nearly half of all natural gas produced in the United States.66 If built, this export capacity could completely offset the total elimination of natural gas from the electric power sector, enabling producers to export all of the gas that they otherwise would have sold to power plants.67

If built, this export capacity could completely offset the total elimination of natural gas from the electric power sector, enabling producers to export all of the gas that they otherwise would have sold to power plants.
LNG advocates love to argue that the export of LNG is necessary to displace coal plants abroad; however, the United States also continues to export coal.68 The switch to natural gas power in the country has actually pushed some of the domestic coal supply overseas, where international consumers burn it.69 Every 10 percent drop in U.S. natural gas prices is associated with a 3.3 percent increase in coal exports.70 As fracking boomed from 2007 to 2013, U.S. coal exports doubled, despite the economic recession.71 However, continued coal exports depend on expanding the capacity at west coast terminals or adding rail capacity to Canada — hotly contested projects that are vulnerable to public opposition.72
These rising fossil fuel exports could be the final nail in the coffin for climate stability. Under so-called “baseline” scenarios — in which no additional mitigation of fossil fuel emissions occurs —the world is on track to hit 4.3 degrees Celsius of warming this century.73
So far, modest reductions in the consumption of coal and oil in member countries of the Organisation for Economic Co-operation and Development (OECD) have been largely offset by an increase in natural gas consumption domestically and by a dramatic rise in fossil fuel use in non-OECD countries.74 Exports would help enable a nearly unlimited supply of fossil fuels, meaning that any policies to mitigate climate change proposed by countries such as the United States, if implemented, would still put the world on track for 3.2 degrees Celsius of warming by 2100.75
Part 4:
Corporations and Democrats Continue Trump’s Energy Agenda
The “all of the above” approach prevents us from curbing the climate crisis.
U.S. state governments have seized on the momentum for climate action by championing the buildout of renewable energy. However, they have avoided confrontation with entrenched fossil fuel interests and refuse to commit to hard limits on supply. Experience shows that building more renewable energy projects is not enough to guarantee deep reductions in emissions — even within the electricity sector. The “energy dominance” doctrine of the Trump administration took the stance that welcoming renewable energy as part of an “all of the above” approach poses no direct threat to fossil fuels.76
While the Biden administration has been more vocally supportive of renewables — promising billions in new spending on technology and development — it has not committed to hard limits on fossil fuel extraction.77 The administration has made clear that it sees fossil fuels as a key part of the future energy mix.78 When pushed, Biden even says, “I’m all for natural gas.”79
Facing pressure from oil and gas interests, some Democrats have embraced carbon capture as a way to keep the oil and gas industry afloat while “complying” with climate goals. However, carbon capture is a favored misdirection tactic, posing as a climate solution. Recent drafts of federal climate legislation have even included carbon capture in a list of “clean” energy sources, elevating it to the same status as real renewable energy such as wind and solar.80 Carbon capture and storage is unproven, prohibitively expensive and, after accounting for the entire emissions lifecycle, incapable of producing deep emissions reductions. Carbon capture can even enable increased oil production by injecting the captured carbon into oil reservoirs.81
Despite the impressive-sounding goals of electricity corporations, the planned time frames for fossil fuel retirements are too slow to meet these goals. Some utility companies are adhering to their climate pledges by divesting from their coal fleets rather than dismantling them, leaving these plants in service under new owners.82 Others corporations are choosing to buy credits, certificates or offsets from renewable energy producers while leaving dirty portions of their supply chain intact.83 Meanwhile, sectors such as technology and airlines have embraced a similar approach to climate pledges, but company insiders have questioned whether these measures have any impact on overall emissions.84
Virginia’s Renewables Seem to Be Token Gestures, While Fossil Fuels Keep Trucking
Plans to build additional renewable energy plants and transition to a more renewable grid in Virginia have been shadowed by new investments in fracked gas infrastructure and a reluctance to phase out existing fossil fuels. Amid growing pressure from climate activists, in 2018 Governor Ralph Northam touted plans by the state’s biggest utility to build 3,000 megawatts of renewable energy.85 Meanwhile, from 2010 to 2020, the state added 6,500 megawatts of new natural gas capacity.86 Despite posturing in support of renewable energy, Northam’s administration supported a number of multi-billion-dollar pipelines to bring natural gas into Virginia.87 Governor Youngkin’s election in 2021 only intensifies the threat of further fossil fuel development in the state, through commitments to weaken climate and environmental protections, dismantle citizen review boards for fossil fuel infrastructure projects, and greenlight fracked gas projects in the name of grid reliability.88
Northam’s administration even won praise nationally for its “landmark” climate bill.89 While the state’s climate bill, the Virginia Clean Economy Act (VCEA), is intended to phase out fossil-fueled power plants, the law takes decades to fully take hold and is riddled with loopholes.90 A legislative effort to clean up those loopholes in 2022 didn’t make it out of Committee, signaling the shifting reality regarding climate policy under Governor Youngkin.91 It is unclear whether the VCEA will have any meaningful impact on the decision making of utilities in the state. Despite the new law, developers have pushed ahead with the environmentally destructive Mountain Valley Pipeline, a 300-mile long project which would carry fracked gas through Virginia.92
Virginia’s added renewable energy projects appear to provide cover for the business-as-usual operation of fossil fuel power plants in the state. Even as a raft of positive press statements have touted the “transformative” nature of the VCEA, long-term resource plans submitted to Virginia’s utility regulator by Dominion Energy tell a starkly different story, including plans to operate natural gas plants long after the targets set by the VCEA.93
Dominion’s plans show that the company intends to retire much of its coal power fleet regardless of the VCEA. This is because many of Dominion’s coal operations have a negative net present value. Conversely, where environmental ambitions compete with profitability, profits appear to win out. Dominion’s plans do not retire any natural gas capacity until 2035 at the earliest, and include 970 megawatts of new gas capacity to be built in the early 2020s.94 Dominion claims that these gas plants are “placeholders,” but the company gives no indication as to what might be built in their place.95 Additionally, Dominion’s plans make little reference to the company’s highly profitable coal units at the Mount Storm power plant in West Virginia.96
Between now and 2035, Dominion’s plan features only 150 megawatts of additional retirements compared to how much the company would have retired if the VCEA had not passed. The biggest change from the “no VCEA” plan is that the VCEA plan retires three 50 megawatt biomass power plants.97 Dominion notes that uncertainty exists regarding the units it plans to retire, stating that, aside from a few units, “inclusion of a unit retirement in this 2020 Plan should be considered as tentative only.”98 These power plants may operate less frequently, but without firm commitments to actually close the plants, lower emissions are not guaranteed.
Do we really have to keep fossil fuels around for reliability?
For utility executives, keeping fossil fuel plants around even while building renewable energy projects makes good business sense, because utilities are often allowed to choose fossil fuel plants over renewable plants to supply electricity when both are available.99 The most common justification for this practice is the supposed reliability advantages of fossil fuels over renewables. Threats of rolling blackouts and sudden outages are a popular and effective fear tactic in defense of keeping fossil fuels on the grid.100 These claims continue even though they are based on outdated understandings of how electricity is produced.101
Hidden in the complexities of electricity markets, regulators often use the spectre of reliability to thumb the scale for fossil fuels, and utilities point to it as a justification for a slow transition away from fossil fuels. Utilities even use the pretense of reliability to operate inefficient plants.102 These claims transcend classic concerns about weather variability, touting the supposedly unique ability of traditional turbines to perform “ancillary services” such as frequency regulation.103 This technical mirage distracts from the fact that other countries have run their entire grids on variable sources of renewable energy (such as wind and solar) for days at a time.104
These reliability justifications are not only propping up coal. Energy regulators in California have discussed the need to also prop up unprofitable natural gas plants on supposed reliability grounds.105 In the state, three needlessly expensive gas plants operating under “reliability must-run” contracts were recently replaced with battery storage at a cost savings, but the process required regulatory intervention and public commission approval.106
The Federal Energy Regulatory Commission (FERC) notes that energy storage technologies are capable of providing ancillary services (frequency regulation, voltage support, spinning reserves), often with faster start-up and ramp times than traditional generators, enabling them to provide these services without already running.107 Academic research also finds that a variety of storage technologies are able to perform ancillary functions, such as backup power, frequency regulation and starts without electricity.108
Battery prices have fallen by nearly 90 percent in the past decade, making them capable of competing with fossil fuels on price alone.109 After switching from gas generators to a battery storage alternative for multiple ancillary services, the Australian Energy Market Operator (AEMO) observed that the battery system provided a more rapid response and higher-quality service.110 In just two years, the battery system slashed grid regulation costs by over 90 percent, saving consumers more than $76 million.111
California’s Renewables Are Overshadowed by Our Oil Addiction
Nationally, California is the go-to example of environmental and climate action, both positively and pejoratively.112 There is some merit to these claims — the state produces the most solar power in the country and ranks near the top in renewable energy production as a percentage of generation.113 However, California is also the largest net importer of electricity, drawing partially on out-of-state coal power plants.114 The market-oriented bias of climate policy in California has left the state vulnerable to regulatory evasion tactics such as resource shuffling (the process of transferring dirty resources out-of-state and importing from dirty sources outside of the regulatory jurisdiction).115
Despite California’s environmental reputation, the fossil fuel industry has a large and entrenched presence. Yes, the state is a leader in renewables, but it is also the seventh largest oil producer in the country.116 In refining capacity, California ranks third behind Texas and Louisiana, with a huge apparatus set up to refine primarily imported oil.117
Much of California’s oil is produced using particularly water-intensive and environmentally destructive extraction measures such as cyclic steam injection, matrix acidizing and hydraulic fracturing (fracking).118 On average, oil produced in California is among the dirtiest sources in the world, resulting in higher lifecycle carbon emissions per barrel than other sources.119
Oil production also has a huge water footprint in California. Food & Water Watch found that from 2018 to June 2021, the oil and gas industry used over 3 billion gallons of freshwater for drilling operations that could otherwise have supplied domestic systems.120 The freshwater sucked up by the oil and gas industry since 2018 could have provided everyone in the city of Pasadena with the recommended amount of daily water for an entire year, or everyone in the city of Ventura for 16 months.121
Industry-backed decision makers and state agencies have enabled widespread drilling.122 Governor Newsom’s offer of a vague plan to end fossil fuel extraction by 2045 offers no guarantee that these fuels would stay in the ground.123 Instead of banning fracking now, Newsom plans to continue issuing fracking permits until 2024.124 These long time frames will doom climate policies, as fossil fuel producers can accelerate their production schedules to extract the reserves before the deadline.125 When producers anticipate an end to permitting, they stockpile and accumulate permits before the deadline hits, sometimes in quantities big enough to neutralize the policy.126
Part 5:
Cozy State Regulators Will Not Choose Renewables Over Fossil Fuels Unless They Have To
Loopholes help fossil fuels compete against renewables.
Curtailment in California
Building new renewable energy sources is often not enough to switch off fossil fuel power plants that were built before clean energy came online. In theory, electricity producers should choose power from renewable sources, which have no fuel costs (rather than paying to burn coal or natural gas).127 But in practice, renewable power plants are sometimes disconnected while utilities continue to burn coal and natural gas.128
This practice of reducing the amount of power supplied from renewables below the amount they are capable of producing is called curtailment. It is often done by disconnecting or reducing at the electrical converter level for solar and changing the blade angle for wind.129 A review of curtailment in four key solar-producing countries found that in 2018, 6.5 million megawatt-hours of solar was curtailed.130 That electricity could have powered all the households of a city around the size of Phoenix for year.131
California leads the nation in solar installation, but the state has largely failed to kick its dependence on natural gas.132 California uses more natural gas than any state other than Texas.133 Instead of building energy storage, California imports out-of-state power and turns to gas generation to fill gaps in solar generation.134 These imports hide the fossil fuel footprint of California’s electricity. Since 2015, natural gas-fired generation has declined by 29 percent in California, but it stayed the same overall in the western U.S. as out-of-state generators picked up the slack.135
Increased solar deployment in California has coincided with increased curtailment.136 From 2014 to 2019, curtailments nearly doubled each year.137 California curtails 2 to 3 percent of its renewable energy production.138 The group that oversees the electricity market and grid, the California Independent System Operator (CAISO), has curtailed more than 5 million megawatt-hours of wind and solar electricity since 2015 (Figure 4).139 That is enough electricity to cover the needs of 740,000 Californian households for a year.140
Fossil Fuels Use Loopholes to Stave Off Renewables
Negative prices, or a surcharge to produce electricity, are a key mechanism to encourage curtailment in California. CAISO enables negative prices by adjusting the price floor to levels that will push out renewable generation.141 In 2017, wholesale prices of power in California hit negative levels.142 But these negative prices are not leading to cheap energy for consumers — Californians pay electricity rates that are among the highest in the nation.143
Negative pricing occurs when plants that are expensive to restart or shutdown continue to operate in anticipation of future demand.144 Pro-renewable policies can drive prices negative, but when fossil-fueled operators continue to run, this pushes prices to the point where renewables — which cost almost nothing to operate — lose money by selling electricity.145 CAISO has directly attempted to protect gas generators from negative prices by curtailing renewable energy.146 California also offers capacity payments for idling gas plants, creating a means for them to stay afloat amid negative wholesale prices.147 These flexibility payments are effectively a handout to gas generators.148
Negative prices reflect an uneven playing field that can favor fossil fuels over renewable energy. CAISO market rules in 2017 allowed natural gas generators to forgo curtailment by appealing to contract stipulations that do not match their technical capacities — in other words, allowing gas plants to pretend to be less flexible than they are.149 FERC even allowed CAISO to contract directly with fossil-fueled power plants that would otherwise be unable to compete with renewable energy.150
Transmission congestion is often cited as a rational for renewable curtailment in California.151 However, transmission capacity often goes unused while renewables are curtailed.152 Contracts signed by the big three California utilities restrict the use of transmission capacity to back up renewables.153 This leads to situations where California continues to import energy while curtailing renewables.154

Curtailment Is a Choice
Policy decisions impact price setting and direct grid investments, which determine the prices received by energy producers. Some level of curtailment may be inevitable in a completely renewable-powered grid at times of low demand, but curtailing renewables in favor of fossil fuels is not a reflection of that dynamic.155
Curtailment rates do not correspond to a proportion of renewables as a percentage of capacity and vary significantly among electricity markets.156 For example, Germany curtails far less than U.S. states with comparable levels of solar development.157 Texas substantially reduced curtailment of wind through public investment in transmission and market design changes to properly value wind energy.158 However, Texas curtailed 8.4 percent of its potential solar output in 2018.159
Investor-owned utilities have proved resistant to building the transmission infrastructure necessary to bring renewable electricity to distant markets.160 Private utilities have gone out of their way to design transmission investments in such a way as to benefit their existing fleets and bottom lines.161 Without significant reforms, these corporations will continue to use legal means to resist change, often with the help of in-their-pocket state governments.162
An electricity policy that prioritizes renewable energy and eliminating fossil fuels from the grid would go a long way to reduce curtailment. Incorporating storage and flexibility could significantly reduce curtailment in California.163 And while natural gas apologists argue that the flexibility of gas power plants enables renewables to run more frequently, non-fossil alternatives (such as demand response and storage) are more effective at reducing curtailment than natural gas generation is.164
Part 6:
Leaders Must Directly Confront Fossil Fuel Production and Use
Supply-side energy policy is crucial for our future.
Policy makers representing fossil fuel-producing regions have signaled willingness to embrace half-hearted market-based climate policies. Even major oil producers have signaled willingness to support a carbon tax.165 These policies pose no real threat to fossil fuel producers because they do not result in deep emissions reductions.166 Not only do fossil fuel pricing schemes create political cover, the revenue streams created by these programs can entrench these industries — leaving policy makers reluctant to cut back on production.167
In Pennsylvania, rather than enact regulations to respond to the dire social and environmental consequences of fracking, lawmakers enacted an “impact fee” that returns payouts from drilling to affected communities — a move welcomed by fracking companies.168 Pennsylvania gas companies supplement their tax contributions with voluntary charity to launder their image.169 The strategies appear somewhat successful. Surveys of Pennsylvania residents find that the popularity of fracking rises in tandem with the size of impact fees.170
Would-be frackers in the United Kingdom openly extol the importance of impact fees for generating the political will to frack. In a plan modeled on the United States, the U.K. chemical company Ineos offered broad-ranging voluntary community payments as part of a comprehensive strategy to push fracking — giving an activity that depletes the environment and erodes our climate future the false patina of social good.171
The following statement captures this gaslighting tactic:
“Giving 6% of revenues to those directly above Shale gas wells means the rewards are fairly shared by everyone. It’s what they do in the USA and we think it is right to do this here. It democratises the Shale gas revolution.”172
Ineos CEO Jim Ratcliffe
Conclusion: Public Policy — Not Market Mechanisms — Is the Only Way Forward
The viability of renewable electricity provides an off-ramp from climate chaos, but if fossil fuel development continues unchecked, we will be locked in to decades of continued carbon emissions and climate crisis.173 Policies that address the fossil fuel supply are a vital component of any successful effort to address climate change. For example, reducing coal subsidies would have a much smaller impact on coal consumption than a ban on new coal mines.174
Limiting production is far easier to enforce than using market mechanisms to reduce consumption. Both carbon taxes and cap-and-trade schemes involve complex and detailed reporting and auditing at thousands of facilities — which creates a difficult job for the government agencies that oversee them.175 In addition to financial costs, complex administration can lead to under reporting and gaming between regulated and unregulated entities, resulting in emissions.176
In contrast, supply policies are easily observable and have predictable outcomes with minimal overhead.177 That is because supply policies impact a smaller number of firms and regulate easily observed commodities rather than the resulting greenhouse gas emissions.178 Moreover, in an alternate scenario where demand reduction works, supply controls would have no additional cost and merely act as an insurance policy.179
The United States is the second-largest greenhouse gas emitter, contributing 15 percent of total global emissions.180 However, some politicians argue that the country cannot substantially reduce global emissions because developing countries continue to increase their emissions.181 This is in part because the trade in carbon-intensive products has grown rapidly, undermining the effectiveness of domestic climate policy on the demand side.182 Many of these same politicians have supported lax trade policies that allow corporations to relocate to other countries to avoid complying with regulations.183 In some cases, countries export fuels that are used to produce products that they then import to consume.184
Even without global cooperation, removing the U.S. fossil fuel reserves from the world market would undermine fossil fuel generation globally.185 While investment and (to a lesser extent) labor can cross borders, fossil fuel reserves are immobile.186 By imposing limits on fossil fuel production within their own borders, countries can guarantee against the relocation of these fuels.187 International agreements that target the supply of fossil fuels are easier to negotiate, verify and enforce because they deal with fewer polluters.188
Recommendations:
- President Biden should use his authority to stop fossil fuel extraction on federal lands.
- President Biden should use his authority to stop the construction of new fossil fuel infrastructure, including LNG exports, by denying the needed federal permits.
- Congress should ban fracking everywhere.
- Congress should pass legislation laying out a managed transition off fossil fuels that protects workers and communities that have depended on the industry.
We can shift right now to the power sources that will change the trajectory of humankind. It just takes the political will of clear-headed leaders working for the good of the people and not the profit margins of the fossil fuel industry.
Send a message to President Biden now. We must end fossil fuels before they end us.
Endnotes
- Milman, Oliver. “Biden’s clean energy plan would cut emissions and save 317,000 lives.” Guardian. July 12, 2021.
- Welsby, Dan et al. “Unextractable fossil fuels in a 1.5°C world.” Nature. Vol. 597. September 2021 at 230.
- Food & Water Watch (FWW) analysis of U.S. Department of Energy (DOE). Energy Information Administration (EIA). June 2021 Monthly Energy Review. Available at https://www.eia.gov/totalenergy/data/monthly and on file with FWW.
- DOE EIA. “Annual Energy Outlook 2021 with projections to 2050: Narrative.” February 3, 2021 at 7 and 22.
- FWW analysis of DOE EIA. Natural Gas Monthly Data. Available at https://www.eia.gov/naturalgas/data.php. Accessed June 2021 and on file with FWW. Note: Figures are an average of the 12 months preceding May 2021; DOE EIA. “Fossil fuel production expected to increase through 2022 but remain below 2019 peak.” Today in Energy. January 15, 2021.
- Welsby, Dan et al. (2021) at 230; Kalmus, Peter et al. Letter to U.S. President Joseph R. Biden. “An open letter from U.S. scientists imploring President Biden to end the fossil fuel era.” October 7, 2021. Available at https://www.biologicaldiversity.org/programs/climate_law_institute/pdfs/An-Open-Letter-from-US-Scientists-Imploring-President-Biden-to-End-the-Fossil-Fuel-Era.pdf.
- Kalmus et al. (2021).
- United Nations Secretary-General. [Press release]. “Secretary-General’s statement on the IPCC Working Group 1 Report on the Physical Science Basis of the Sixth Assessment.” August 9, 2021.
- Lazard. Lazard’s Levelized Cost of Energy Analysis. Version 14. October 2020 at 9.
- Ibid. at 8 and 10 to 13.
- DOE EIA. Electric Power Monthly, Net Generation All Sectors Monthly. Available at https://www.eia.gov/electricity/data/browser. Accessed January 2021 and on file with FWW; Carley, Sanya et al. “Empirical evaluation of the stringency and design of renewable portfolio standards.” Nature Energy. Vol. 3. July 2018 at 754 and 761; Rossi, Jim. “Carbon taxation by regulation.” Minnesota Law Review. Vol. 102, No. 277. November 2017 at 302.
- Diesendorf, Mark and Ben Elliston. “The feasibility of 100% renewable electricity systems: A response to critics.” Renewable and Sustainable Energy Reviews. Vol. 93. October 2018 at 318.
- Hansen, Kenneth et al. “Status and perspectives on 100% renewable energy systems.” Energy. Vol. 175. May 2019 at 471 and 475.
- Rhodes, J. D. et al. “Baseload power potential from optimally-configured wind, solar and storage power plants across the United States.” Nature Communications. 2020 at 15.
- DOE EIA (January 2021).
- Ibid.; FWW analysis of DOE EIA. Annual Coal Report 2020. Natural Gas Gross Withdrawals and Production 2020. U.S. Field Production of Crude Oil. Available at https://www.eia.gov/naturalgas/data.php and on file with FWW; U.S. Environmental Protection Agency (EPA). Greenhouse Gas Equivalencies Calculator. Updated March 2021. Available at https://www.epa.gov/energy/greenhouse-gas-equivalencies-calculator and on file with FWW.
- DOE EIA (February 3, 2021) at 7.
- Gorski, Irena and Brian S. Schwartz. “Environmental health concerns from unconventional natural gas development.” Oxford Research Encyclopedia Global Public Health. February 2019 at 11 and 39.
- Castelli, Matthew. “Fracking and the rural poor: Negative externalities, failing remedies, and federal legislation.” Indiana Journal of Law and Social Equality. Vol. 3, Iss. 2. May 2015 at 281 and 285 to 287; Zwickl, Klara. “The demographics of fracking: A spatial analysis for four U.S. states.” Ecological Economics. Vol. 161. July 2019 at 202.
- DOE EIA. Gas Production by Shale Play. Available at https://www.eia.gov. Accessed October 2021 and on file with FWW; DOE EIA. “U.S. dry natural gas production and rig count continue to grow from pandemic lows.” Today in Energy. June 17, 2021.
- Calculation assumes 86 (20-year) global warming potential of methane and methane leakage of 3.5 percent. From Howarth, Robert W. “Ideas and perspectives: Is shale gas a major driver of recent increase in global atmospheric methane?” Biogeosciences. Vol. 16, Iss. 15. August 2019 at 3038 to 3040; EPA (2021).
- Covert, Thomas et al. “Will we ever stop using fossil fuels?” Journal of Economic Perspectives. Vol 30, No. 1. Winter 2016 at 119.
- Ibid at 125 to 126.
- DOE EIA. “U.S. oil and natural gas proved reserves and production set new records in 2018.” Today in Energy. January 13, 2020.
- See calculation in footnote 21; EPA (2021).
- DOE EIA. “U.S. Energy-Related Carbon Dioxide Emissions, 2019.” September 30, 2020 at 3.
- FWW analysis of DOE EIA. Natural Gas Monthly Data.
- FWW analysis of DOE EIA. June 2021 Monthly Energy Review. Note: FWW defines renewables as solar, wind and geothermal.
- Ibid.
- FWW analysis of DOE EIA. Form EIA-860 data, 2019. Available at https://www.eia.gov/electricity/data/eia860. Accessed January 2021 and on file with FWW; PJM Interconnection. [Press release]. “PJM prepared to ensure a reliable grid during August solar eclipse.” July 31, 2017.
- FWW analysis of DOE EIA. Form EIA-860 data, 2016. Note: The average age of U.S. gas-fired power plants is 24 years, but 643 (12 percent) began operating before 1968, 50 years ago, and the oldest gas plant went online in 1915.
- DOE EIA (February 3, 2021) at 14.
- FWW DOE EIA. Natural Gas Monthly Data. Accessed June 2021.
- Steinberg, Daniel et al. DOE. National Renewable Energy Laboratory (NREL). “Electrification & Decarbonization: Exploring U.S. Energy Use and Greenhouse Gas Emissions in Scenarios With Widespread Electrification and Power Sector Decarbonization.” NREL/TP-6A20-68214. July 2017 at vi, 12 and 13.
- Zhu, Yifang et al. University of California, Los Angeles (UCLA). Fielding School of Public Health. “Effects of Residential Gas Appliances on Indoor and Outdoor Air Quality and Public Health in California.” April 2020 at 6.
- Reyna, Janet L. and Mikhail V. Chester. “Energy efficiency to reduce residential electricity and natural gas use under climate change.” Nature Communications. Vol. 8. May 2017 at 2.
- Onat, Nuri Cihat et al. “Towards greening the U.S. residential building stock: A system dynamics approach.” Building and Environment. Vol. 78. 2014 at 76 to 78; Mundaca, Luis et al. “Demand-side approaches for limiting global warming to 1.5 °C.” Energy Efficiency. Vol. 12. August 2018 at 4.
- Onat, Nuri Cihat et al. (2014) at 76 and 77.
- Tomich, Jeffrey. “Gas ban backlash spreads across the U.S.” E&E News. February 2, 2021.
- DOE EIA (February 3, 2021) at 25.
- Ibid. at 25 and 26.
- American Chemistry Council (ACC). “U.S. Shale Gas Infographic February 2021.” February 2021.
- DOE EIA (February 3, 2021) at 8.
- DOE EIA. “U.S. ethane exports rise in 2019 as China receives its first U.S. cargos.” Natural Gas Weekly Update. January 30, 2020; DOE EIA. Petroleum Supply Annual 2010, Volume 2. July 28, 2011 at table 1; DOE EIA. Petroleum Supply Annual 2020, Volume 2. August 31, 2021 at table 1.
- DOE EIA. “EIA forecasts resilient, growing ethane production through 2021.” Natural Gas Weekly Update. August 13, 2020.
- Laris, Michael. “In the shadows of Refinery Row, a parable of redevelopment and race.” Washington Post. October 21, 2017.
- Asbury, Martina. PetroChemical Update. “U.S. Northeast Petrochemical Industry: Market Outlook 2018.” November 2017 at 5; Blunt, Katherine. “Ethane consumption surges with petrochemcial boom.” Houston Chronicle. February 24, 2018; Blunt, Katherine. “Houstonarea petrochemical producers look overseas to sell plastic.” Houston Chronicle. February 1, 2018.
- Jambeck, Jenna R. et al. “Plastic waste inputs from land into the ocean.” Science Magazine. Vol. 347. Iss. 6223. February 13, 2015 at 768
- Worm, Boris et al. “Plastic as a persistent marine pollutant.” Annual Review of Environment and Resources. Vol. 42. 2017 at 2.
- Geyer, Roland et al. “Production, use, and fate of all plastics ever made.” Science Advances. Vol. 3. 2017 at 1.
- Zheng, Jiajia and Sangwon Suh. “Strategies to reduce the global carbon footprint of plastics.” Nature Climate Change. Vol. 9, Iss. 5. April 2019 at 374 and 375.
- DOE EIA. “In 2019, U.S. energy production exceeded consumption for the first time in 62 years.” Today in Energy. April 28, 2020.
- DOE EIA. “EIA forecasts that U.S. natural gas consumption will decline through 2022.” Natural Gas Weekly Update. April 8, 2021.
- DOE EIA (June 17, 2021).
- DOE EIA. “U.S. natural gas exports and non-power sector demand to drive higher prices through 2022.” Today in Energy. June 22, 2021.
- Tuladhar, Sugandha D. et al. NERA Economic Consulting. Prepared for DOE. “Macroeconomic Outcomes of Market Determined Levels of U.S. LNG Exports.” June 7, 2018 at 21.
- DOE EIA. U.S. Natural Gas Exports and Re-Exports by Point of Exit. August 31, 2018.
- Dixon, Sean T. “Deepwater liquefied natural gas ports and the shifting U.S. liquefied natural gas market.” Ocean and Coastal Law Journal. Vol. 17, No. 1. Article No. 2. 2011 at 3, 4 and 23; Parfomak, Paul W. U.S. Congressional Research Service (CRS). “Liquefied Natural Gas (LNG) Infrastructure Security: Background and Issues for Congress.” RL32073. September 9, 2003 at CRS-2.
- Clark, Nigel N. et al. “Pump-to-wheels methane emissions from the heavy-duty transportation sector.” Environmental Science & Technology. Vol. 51. December 2017 at 969.
- Corkhill, Mike. “Two Sabine Pass LNG tanks removed from service.” LNG World Shipping. February 13, 2018.
- Bousso, Ron. “LNG growth to propel oil and gas industry’s carbon emissions — WoodMac.” Reuters. September 20, 2017; Boersma, Tim and Sarah M. Jordaan “Whatever happened to the Golden Age of natural gas?” Energy Transit. Vol. 1, No. 5. August 2017 at 1 and 2.
- Pihl, Kristi. “Update: Evacuation radius near Plymouth plant to be reduced.” Tri-City (WA) Herald. March 31, 2014.
- Pihl (2014); Mandel, Jenny. “Explosive LNG issues grab PHMSA’s attention.” E&E News. June 7, 2016.
- Ehrenfeld, David. “The environmental limits to globalization.” Conservation Biology. Vol. 19, No. 2. April 2005 at 321.
- DOE EIA. “U.S. LNG exports set another record in December.” Natural Gas Weekly Update. January 7, 2021.
- DOE EIA (June 17, 2021).
- FWW analysis of DOE EIA. Natural Gas Monthly Data. Accessed June 2021.
- DOE EIA. “Coal Explained; Coal Imports and Exports.” May 27, 2021.
- Feng, Kuishuang et al. “Drivers of the US CO2 emissions 1997-2013.” Nature Communications. Vol. 6. July 2015 at 5; Broderick, John and Kevin Anderson. University of Manchester. “Has US Shale Gas Reduced CO2 Emissions?” Tyndall Manchester Climate Change Research. October 2012 at 4.
- Knittel, Christopher et al. “Are we fracked? The impact of falling gas prices and the implications for coal-to-gas switching and carbon emissions.” Oxford Review of Economic Policy. Vol. 32, No. 2. April 2016 at 253.
- Feng et al. (2015) at 4 and 5.
- Mendelevitch, Roman et al. “The death spiral of coal in the U.S.: Will changes in U.S. policy turn the tide?” Climate Policy. Vol. 19, No. 10. July 2019 at 1316.
- Intergovernmental Panel on Climate Change (IPCC). “Climate Change 2014 Synthesis Report.” 2015 at 8 and 10; IPCC. “IPCC Special Report on the Ocean and Cryosphere in a Changing Climate: Summary for Policymakers.” 2019 at 8.
- BP Plc. “BP Statistical Review of World Energy 2019.” June 2019 at 9; BP Plc. “BP Statistical Review of World Energy June 2006.” June 2006 at 12, 28 and 35.
- Raftery, Adrian E. et al. “Less than 2° C warming by 2100 unlikely.” Nature Climate Change. Vol. 7. July 2017 at 1.
- Zinke, Ryan K. “American energy dominance means Mass. wind.” Boston Globe. April 16, 2018.
- Penrod, Emma. “Biden proposes more than $2B for clean energy infrastructure, $14B+ increase in climate spending.” Utility Dive. June 1, 2021.
- Jean, Renée. “Biden’s energy secretary affirms there is a future for the oil and gas industry in a low carbon world.” Williston (ND) Herald. May 14, 2021.
- Aton, Adam. “Biden’s promise to unions: ‘I’m all for natural gas’.” E&E News. March 4, 2021.
- Hughes, Siobhan and Aaron Zitner. “Democrats in oil country worried by party’s natural-gas agenda.” Wall Street Journal. June 29, 2021.
- FWW. [Issue brief]. “The Case Against Carbon Capture: False Claims and New Pollution.” March 2020 at 3 and 6 to 8.
- Ryser, Jeffrey. “Utility emissions, renewable goals accelerate, but coal retirements may be too slow.” S&P Global. February 25, 2021.
- Naik, Gautam and Esther Whieldon. “Carbon offsets prove risky business for net zero targets.” S&P Global. May 12, 2021; Frazin, Rachel. “Major electric company sets goal for net-zero emissions by 2050.” The Hill. April 28, 2020; Whieldon, Esther. “Path to net zero: 70% of biggest US utilities have deep decarbonization targets.” S&P Global Market Intelligence. December 9, 2020; Danko, Pete. “Portland General Electric sets aggressive new carbon-reduction targets.” Portland Business Journal. November 18, 2020; Samuel, Molly. “Atlanta-based Southern Company commits to net zero carbon emissions.” National Public Radio (NPR). WABE–Atlanta, GA. May 27, 2021.
- Schechner, Sam. “Amazon and other tech giants race to buy up renewable energy.” Wall Street Journal. June 23, 2021; Naik and Whieldon (2021).
- Martz, Michael. “Dominion moves ahead with plan to build a pair of wind turbines off the Virginia coast.” Richmond Times-Dispatch. August 3, 2018.
- FWW analysis of DOE EIA. Form-860 data, 2020. EIA. Available at https://www.eia.gov/electricity/data/eia860 and on file with FWW. Accessed June 2021.
- Leonor, Mel. “Northam lays out renewable energy goals for Virginia, calls for carbon-free electricity by 2050.” Richmond Times-Dispatch. September 17, 2019; Penn, Ivan. “Atlantic Coast Pipeline canceled as delays and costs mount.” New York Times. July 5, 2020; Vogelsong, Sarah. “More delays, cost increases for Mountain Valley Pipeline.” Virginia Mercury. May 4, 2021.
- Hammack, Laurence. “Gubernatorial candidates comment, or choose not to, on Mountain Valley Pipeline.” Roanoke Times. October 9, 2021; Wilson, Patrick. “Va. Senate democrats pass GOP bill to remove power of citizen environmental boards.” Richmond Times-Dispatch. February 14, 2022.
- Schneider, Gregory S. “Virginia becomes the first Southern state with a goal of carbon-free energy.” Washington Post. April 13, 2020.
- Virginia Office of the Governor. [Press release]. “Governor Northam signs clean energy legislation.” April 12, 2020; Dominion Energy. “Virginia Electric and Power Company’s Report of Its Integrated Resource Plan Before the Virginia State Corporation Commission and North Carolina Utilities Commission.” Case No. PUR-2020-00035. Docket No. E-100, Sub 165. May 1, 2020 at 2 and 18.
- FWW. [Press release]. “Virginia House of Delegates committee votes down the New Virginia Economy Act.” February 8, 2022.
- Hammack, Laurence. “Stream crossings continue to muddy the waters for Mountain Valley Pipeline.” Roanoke Times. June 28, 2021; Vogelsong (2021).
- Vogelsong, Sarah. “Despite Clean Economy Act, Dominion forecasts a strong role for natural gas in Virginia.” Virginia Mercury. May 8, 2020; Virginia Office of the Governor (2020); Shepherd, Walton. Natural Resources Defense Council. “How to Rev Up Virginia’s New Climate Action Engine.” March 11, 2020; Tidwell, Mike. Chesapeake Climate Action Network. “Virginia Clean Economy Act: A Big Step Forward on Climate Policy.” February 13, 2020; Francis, Lee. Virginia League of Conservation Voters. [Press release]. “Virginia News: Gov. Northam Signs Clean Economy Act.” April 13, 2020.
- Dominion Energy (2020) at 28, 29, 83 and Appendix 2A.
- Ibid. at 28 and 29.
- Ibid. at 83.
- Ibid. at 27 to 29.
- Ibid. at 83.
- Morehouse, Catherine. “Ex-FERC commissioners debate solutions to coal self-commitments said to cost millions.” Utility Dive. June 1, 2020.
- “More green blackouts ahead.” Wall Street Journal. February 23, 2021.
- Rossi, Jim. “Electricity charges, mandates and subsidies.” In Dernbach, John and Michael Gerrard (Eds.). (2019). Legal Transitions to Deep Decarbonization in the United States. Washington, DC: Environmental Law Institute at 601.
- Morehouse (2020).
- Dominion Energy (2020) at 71 to 75 and 83.
- Diesendorf and Elliston (2018) at 318 and 320.
- Gifford, Raymond L. and Matthew S. Larson. Wilkinson Barker Knauer LLP. “‘Around Market,’ ‘In Market,’ and FERC at a Crossroads.” May 2018 at 11.
- Nemec, Rich. “California OKs PG&E plan to replace gas-fired power plants with battery storage.” Natural Gas Intelligence. November 19, 2018.
- Campbell, Richard J. CRS. “Electricity Storage: Applications, Issues, and Technologies.” R45980. October 9, 2019 at 19.
- Baumgarte, Felix et al. “Business Models and Profitability of Energy Storage.” Science. Vol. 23, Iss. 10. October 2020 at 6.
- Trahey, Lynn et al. “Energy storage emerging: A perspective from the Joint Center for Energy Storage Research.” PNAS. Vol. 117, No. 23. June 2020 at 12551 to 12555; BloombergNEF. [Press release]. “Battery pack prices fall as market ramps up with average at $156/kWh in 2019.” December 3, 2019; Schmidt, Oliver. “Projecting the future levelized cost of electricity storage technologies.” Joule. Vol. 3. January 2019 at 81.
- Australian Energy Market Operator. “Initial Operation of the Hornsdale Power Reserve Battery Storage System.” April 2018 at 7 and 8; Parkinson, Giles. “How Tesla’s big battery is bringing Australia’s gas cartel to heel.” Guardian. February 2, 2018.
- Thornhill, James. “Two years on, Elon Musk’s big battery bet is paying off in Australia.” Bloomberg. February 27, 2020.
- “California’s climate contradictions.” Wall Street Journal. February 26, 2021; Environmental Defense Fund (EDF). “California leads fight to curb climate change.” Available at https://www.edf.org/climate/california-leads-fight-curb-climate-change. Accessed June 2021.
- DOE EIA. “California: State Energy Profile.” February 18, 2021.
- Ibid.
- Cullenward, Danny. “How California’s carbon market actually works.” Bulletin of the Atomic Scientists. Vol. 70, Iss. 5. 2014 at 38 and 39.
- DOE EIA (February 18, 2021).
- Ibid.
- Long, Jane C. S. et al. California Council on Science and Technology and Lawrence Berkeley National Laboratory. Prepared for the California Council on Science and Technology. “An Independent Scientific Assessment of Well Stimulation in California: Summary Report.” July 2015 at 3, 5, 16, 18 and 20; Hanzlik, E. J. et al. “Forty years of steam injection in California — The evolution of heat management.” Society of Petroleum Engineers International. Paper No. SPE-84848-MS. 2003 at 1; California Department of Conservation (DOC). “Analysis of Oil and Gas Well Stimulation Treatments in California — 6. Overview of California’s Oil and Gas Resources.” June 2015 at 6-1, 6-12, 6-14 and 6-16; California Department of Conservation (DOC). “Oil and Gas Production: History in California.” 2005 at 7.
- Stark, Kevin. “’Bottom of the barrel’ California oil can be far more carbon intensive than what state imports.” NPR. KQED–San Francisco, CA. June 28, 2021.
- FWW analysis of CA DOC. California Geologic Energy Management Division (CalGEM). WellSTAR, Well Injection Data (BQ), 2018 — June 2021. Available at https://wellstar-public.conservation.ca.gov/General/PublicDownloads/Index. Accessed July 2021. Note: FWW calculated water injected into California wells from 2018 through June 2021 using any water source and domestic water systems (source code 03). Water volume converted from barrels to gallons.
- FWW analysis of Ibid. and U.S. Census Bureau (USCB). Annual Estimates of the Resident Population for Incorporated Places in California: April 1, 2010 to July 1, 2019. Available at https://www.census.gov/data/tables/time-series/demo/popest/2010s-total-cities-and-towns.html. Accessed May 28, 2021. Calculation example: 3,017,856,156 gallons of freshwater injected by oil and gas operations (2018 — June 2021) / water recommendation (55 gallons/day/person) / 141,029 Population of Pasadena = 389 days.
- DOC (2005) at 2 and 8; California Department of Finance. “California Budget 2019-20, Natural Resources Budget.” January 2019 at 53.
- Gardiner, Dustin. “For environmentalists, California’s Legislature has been ‘a bloodbath’ this year.” San Francisco Chronicle. June 5, 2021; Bowman, Emma. “California Governor moves to ban fracking by 2024.” NPR. April 23, 2021.
- Ibid.
- Sinn, Hans-Werner. “The green paradox: A supply-side view of the climate problem.” Review of Environmental Economics and Policy. Vol. 9, Iss. 2. Summer 2015 at 239 to 244; de Sa, Andrade Saraly and Julien Daubanes. “Limit pricing and the (in)effectiveness of the carbon tax.” Journal of Public Economics. Vol. 139. July 2016 at 29 and 30.
- Magill, Bobby. “Oil, gas industry stockpiled drilling leases before Biden ‘pause.’” Bloomberg Law. January 28, 2021.
- Bird, Lori et al. DOE NREL. “Wind and solar energy curtailment: Experience and practices in the United States.” NREL/TP-6A20-60983. March 2014 at 2; O’Shaughnessy, Eric et al. “Too much of a good thing? Global trends in the curtailment of solar PV.” Solar Energy. Vol. 208. September 2020 at 1068.
- Trabish, Herman K. “Prognosis negative: How California is dealing with below-zero power market prices.” Utility Dive. May 11, 2017.
- Denholm, Paul et al. DOE NREL. “Overgeneration from Solar Energy in California: A Field Guide to the Duck Chart.” NREL/TP-6A20-65023. November 2015 at 1.
- O’Shaughnessy et al. (2020) at 1068.
- EPA (2021); USCB. Annual Estimates of the Resident Population for Incorporated Places in Arizona: July 1, 2019. Available at https://www.census.gov/quickfacts/fact/table/phoenixcityarizona/PST045219. Accessed October 2021.
- DOE EIA. “As solar-powered generation increases in California, natural gas helps meet evening peak demand.” Natural Gas Weekly Update. November 5, 2020
- DOE EIA (February 18, 2021).
- DOE EIA. (November 2020).
- DOE EIA. “Natural gas-fired generation has increased in most U.S. regions since 2015.” Today in Energy. December 4, 2020.
- Roth, Sammy. “California has too much solar power. That might be good for ratepayers.” Los Angeles Times. June 5, 2019.
- Canonica, Rocco and Kassia Micek. “Rapid renewables growth brings challenges for US states: Part 1: California.” S&P Global Platts. April 8, 2020.
- Ibid.
- FWW analysis of California Independent System Operator. Wind and Solar Curtailment Totals by Month. Available at http://www.caiso.com/informed/Pages/ManagingOversupply.aspx. Accessed July 2021.
- FWW analysis of DOE EIA. 2021 Form-861 data. Available at https://www.eia.gov/electricity/data.php. Accessed July 2021 and on file with FWW.
- Bird et al. (2014) at 9.
- Walton, Robert. “California solar spike leads to negative CAISO real-time prices in March.” Utility Dive. April 10, 2017.
- DOE EIA. “Rising solar generation in California coincides with negative wholesale electricity prices.” Today in Energy. April 7, 2017.
- Trabish (2017).
- Ibid.
- Ibid.
- Ibid.
- Roselund, Christian. “California’s solar and wind integration challenge.” PV Magazine. July 30, 2018.
- Paulos, Bentham. “Too much of a good thing? An illustrated guide to solar curtailment on California’s grid.” Greentech Media. April 3, 2017.
- Federal Energy Regulatory Commission (FERC). Docket No. ER19-1641-001. Dissent. September 27, 2019 at 1 to 3 and 5; FERC. Docket No. ER19-1641-001. Order Accepting Tariff Revisions. September 27, 2019 at 1 and 2;
- Bird et al. (2014) at 4.
- Trabish (2017).
- Roselund (2018).
- Roselund (2018).
- Denholm, Paul et al. (2015) at i and 4.
- Sun, Yinong et al. DOE NREL. “2018 Renewable Energy Grid Integration Data Book.” 2020 at 10, 24 and 27.
- O’Shaughnessy et al. (2020) at 1070.
- Bird et al. (2014) at 9.
- O’Shaughnessy et al. (2020) at at 1069.
- Peskoe, Ari. Harvard Law School. “Is the Utility Transmission Syndicate Forever?” Working Paper. February 16, 2021 at 2 and 3.
- Ibid at 2 and 75.
- Ibid.
- Denholm, Paul et al. (2015) at iii.
- Ibid at 8; Dominion Energy (2020) at 71 to 75 and 83.
- Climate Leadership Council. “The Consensus Climate Solution.” Wall Street Journal. Paid Advertisement. June 20, 2017 at A6B; Mufson, Steven and Joshua Partlow. “Oil, gas industry says it will support carbon pricing.” Washington Post. March 25, 2021; Gray, Boyden C. “The misguided ExxonMobil climate change inquisition.” Forbes. February 11, 2016.
- Green, Jessica F. “Does carbon pricing reduce emissions? A review of ex-post analyses.” Environmental Research Letters. Vol. 16, No. 4. March 2021 at 2.
- Prasad, Monica. “Taxation as a regulatory tool: Lessons from environmental taxes in Europe.” In Balleisen, Edward J. and David A. Moss (Eds.). (2010). Government and Markets: Toward a New Theory of Regulation. New York: Cambridge University Press at 370 and 371.
- Wilber, Tom. “Impact fees buy goodwill in drilling communities.” USA Today. November 22, 2015.
- Ibid.
- Paydar, Naveed H. et al. “Fee disbursements and the local acceptance of unconventional gas development: Insights from Pennsylvania.” Energy Research & Social Science. Vol. 20. October 2016 at 1.
- Tovey, Alan. “Ineos offers £2.5bn to communities disrupted by shale gas.” Telegraph. September 28, 2014.
- Ineos. [Press release]. “INEOS plans £2.5 billion shale gas giveaway.” September 28, 2014.
- Lazarus, Michael and Harro van Asselt. “Fossil fuel supply and climate policy: Exploring the road less taken.” Climatic Change. Vol. 150. August 2018 at 4.
- Mendelevitch, Roman. German Institute for Economic Research (DIW Berlin). “Testing Supply‐Side Climate Policies for the Global Steam Coal Market – Can They Curb Coal Consumption?” DIW Discussion Papers No. 1604. 2016 at 1.
- Green, Fergus and Richard Denniss. “Cutting with both arms of the scissors: The economic and political case for restrictive supply-side climate policies.” Climatic Change. Vol. 150. 2018 at 77.
- Ibid.
- Collins, Kim and Roman Mendelevitch. DIW Berlin. “Leaving Coal Unburned: Options for Demand-Side and Supply-Side Policies.” DIW Roundup: Politik im Fokus. No. 87. December 2015 at 3.
- Green & Denniss (2018) at 77.
- Asheim, G. B. et al. “The case for a supply-side climate treaty.” Science. Vol. 365. Iss. 6451. July 2019 at 326.
- Pierre-Louis, Kendra. “Greenhouse gas emissions rise like a ‘speeding freight train’ in 2018.” New York Times. December 5, 2018.
- Johnson, Luke. “Marco Rubio on climate change: ‘The government can’t change the weather’.” Huffington Post. February 13, 2013; Jaipuriar, Rashika and Sarah Bowman. “New GOP-only caucus explicitly acknowledges climate change, but keeps fossil fuels on its list of solutions.” Detroit Free Press. June 25, 2021; Friedman, Lisa and Coral Davenport. “Amid extreme weather, a shift among republicans on climate change.” New York Times. August 13, 2021.
- Andrew, Robbie M. et al. “Climate policy and dependence on traded carbon.” Environmental Research Letters. Vol. 8. 2013 at 1.
- Ahlvik, Lassi and Matti Liski. Norwegian School of Economics and Aalto University. “Carbon Leakage: A Mechanism Design Approach.” October 2017 at 2; Friedman & Davenport (2021); Office of U.S. Senator Mike Braun. [Press release]. “President Trump is closing a China trade deal that’s four decades overdue.” May 16, 2019.
- Asheim et al. (2019) at 325; Barret, John et al. “Consumption-based GHG emission accounting: A UK case study.” Climate Policy. Vol. 13, No. 4. June 2013 at 451 and 452.
- Sinn (2015) at 239 to 244.
- Asheim, Geir B. “A distributional argument for supply-side climate policies.” Environmental and Resource Economics. Vol. 56. 2013 at 252.
- Ibid.
- Asheim et al. (2019) at 327.